Application of Position weight matrix plus interaction couple (PWM+IC) to predict RNA/DNA - protein interaction using high-throughput result
Hsuan-Chun Lin 2015
I would like to thank David R. Anderson for sharing me the R codes from his Nature paper which inspired this project and gave me the opportunity to dig into Machine learning and statistics.
Position weight matrix (PWM) has been widely applied to describe nucleotide importance of RNA/DNA - protein interaction. The basic assumption of PWM is that each necleotide does not interact and follows the iid rule in statistics. Which means PWM has limited ability to detected the mutual effects of nucleotides. For example, RNA/DNA have secondary structures and sometimes specific nucleotide pairs in neighbor or separate positions may enhance or decrease the interaction. Therefore we put interaction couple (IC) and trying to describe this phenomenoum, and this is PWM+PC method.
Like PWM, we implement PWM+IC by a linear regression model in R. We add interaction terms into the PWM linear model and do the fitting. The coefficients of each term is extracted and used to describe the rules of RNA/DNA - protein interaction.
In this repository, Original_Anderson_PWM_IC.R is the original PWM + IC model file. We mamunaly add the interaction terms into the linear model. But once we have different protein to analyse, it loses the convenience. Therefore the PWM_IC.R file solves this issue.
Visualization demo:
graph LR;
	A[RKA binding profile in .csv]-->B[make_chr_table.R];
	B -- generate --> C[chr_table.csv];
	C --> D[PWM.R];
	C --> E[RWM_IC.R];
	E -- Export --> F[demo_heat.csv];
	E -- Export --> G[demo_model4_real_number.csv];
	F -- heatmap_for_IC.R --> H[Heatmap]
	G -- heatmap_model4.R --> I[Heatmap]
Please refer to demo_data.csv for the information. The data should look like:
| Sequence | RK |
|---|---|
| AAAAAA | 1.657295597 |
| AAAAAC | 1.599794083 |
| AAAAAG | 1.33531259 |
| AAAAAT | 1.757484504 |
| ..... | ..... |
In this table, RK value can be the result of HiTS-EQ (Binding) or HiTS-KIN (Catalysis). Which means it can be relative association constant (RKA) or relative rate constant (RK).
Use make_char_table.R to generate charater table. This table shoule be in .csv format.
For the demo, please check the file chr_table.csv.
For PWM model, please use PWM.R For PWM+IC model, please use PWM_IC.R.
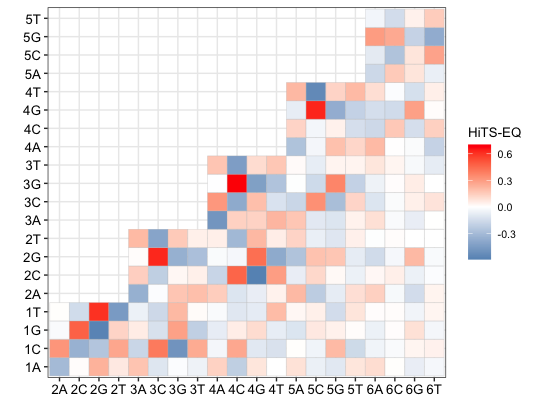
According to the heatmap visualization, there are few parameters need to be set in PWM_IC.R. They are
write.csv(matrix2, "demo_heat.csv")
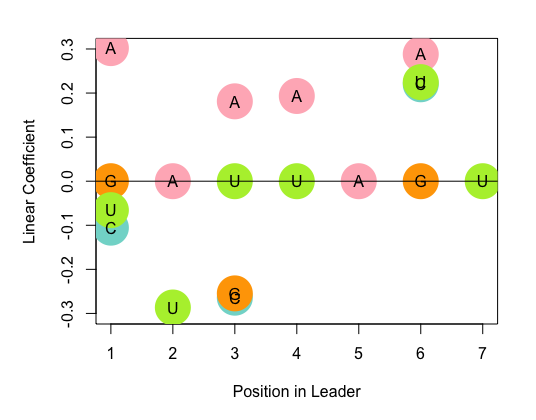
write.csv(model4.coef, "demo_model4_real_number.csv")
Please change demo_heat.csv and demo_model4_real_number.csv to your preferred filenames. You will use those two files to visualize the PWM+IC model by heatmap.
Now you can use heatmap_for_IC.R and import demo_heat.csv or your filename to visualize the PWM+IC for your protein.
heatmap_model4.R is to visualize the demo_model4_real_number.csv file for stepwised result.
- Hidden specificity in an apparently nonspecific RNA-binding protein, Ulf-Peter Guenther, Lindsay E Yandek, Courtney N Niland, Frank E Campbell, David Anderson, Vernon E Anderson, Michael E Harris, Eckhard Jankowsky Nature 2013 Oct 17;502(7471):385-8.
- Analysis of the RNA Binding Specificity Landscape of C5 Protein Reveals Structure and Sequence Preferences that Direct RNase P Specificity Hsuan-Chun Lin, Jing Zhao, Courtney N Niland, Brandon Tran, Eckhard Jankowsky, Michael E Harris Cell Chem Biol. 2016 Oct 20;23(10):1271-1281.

