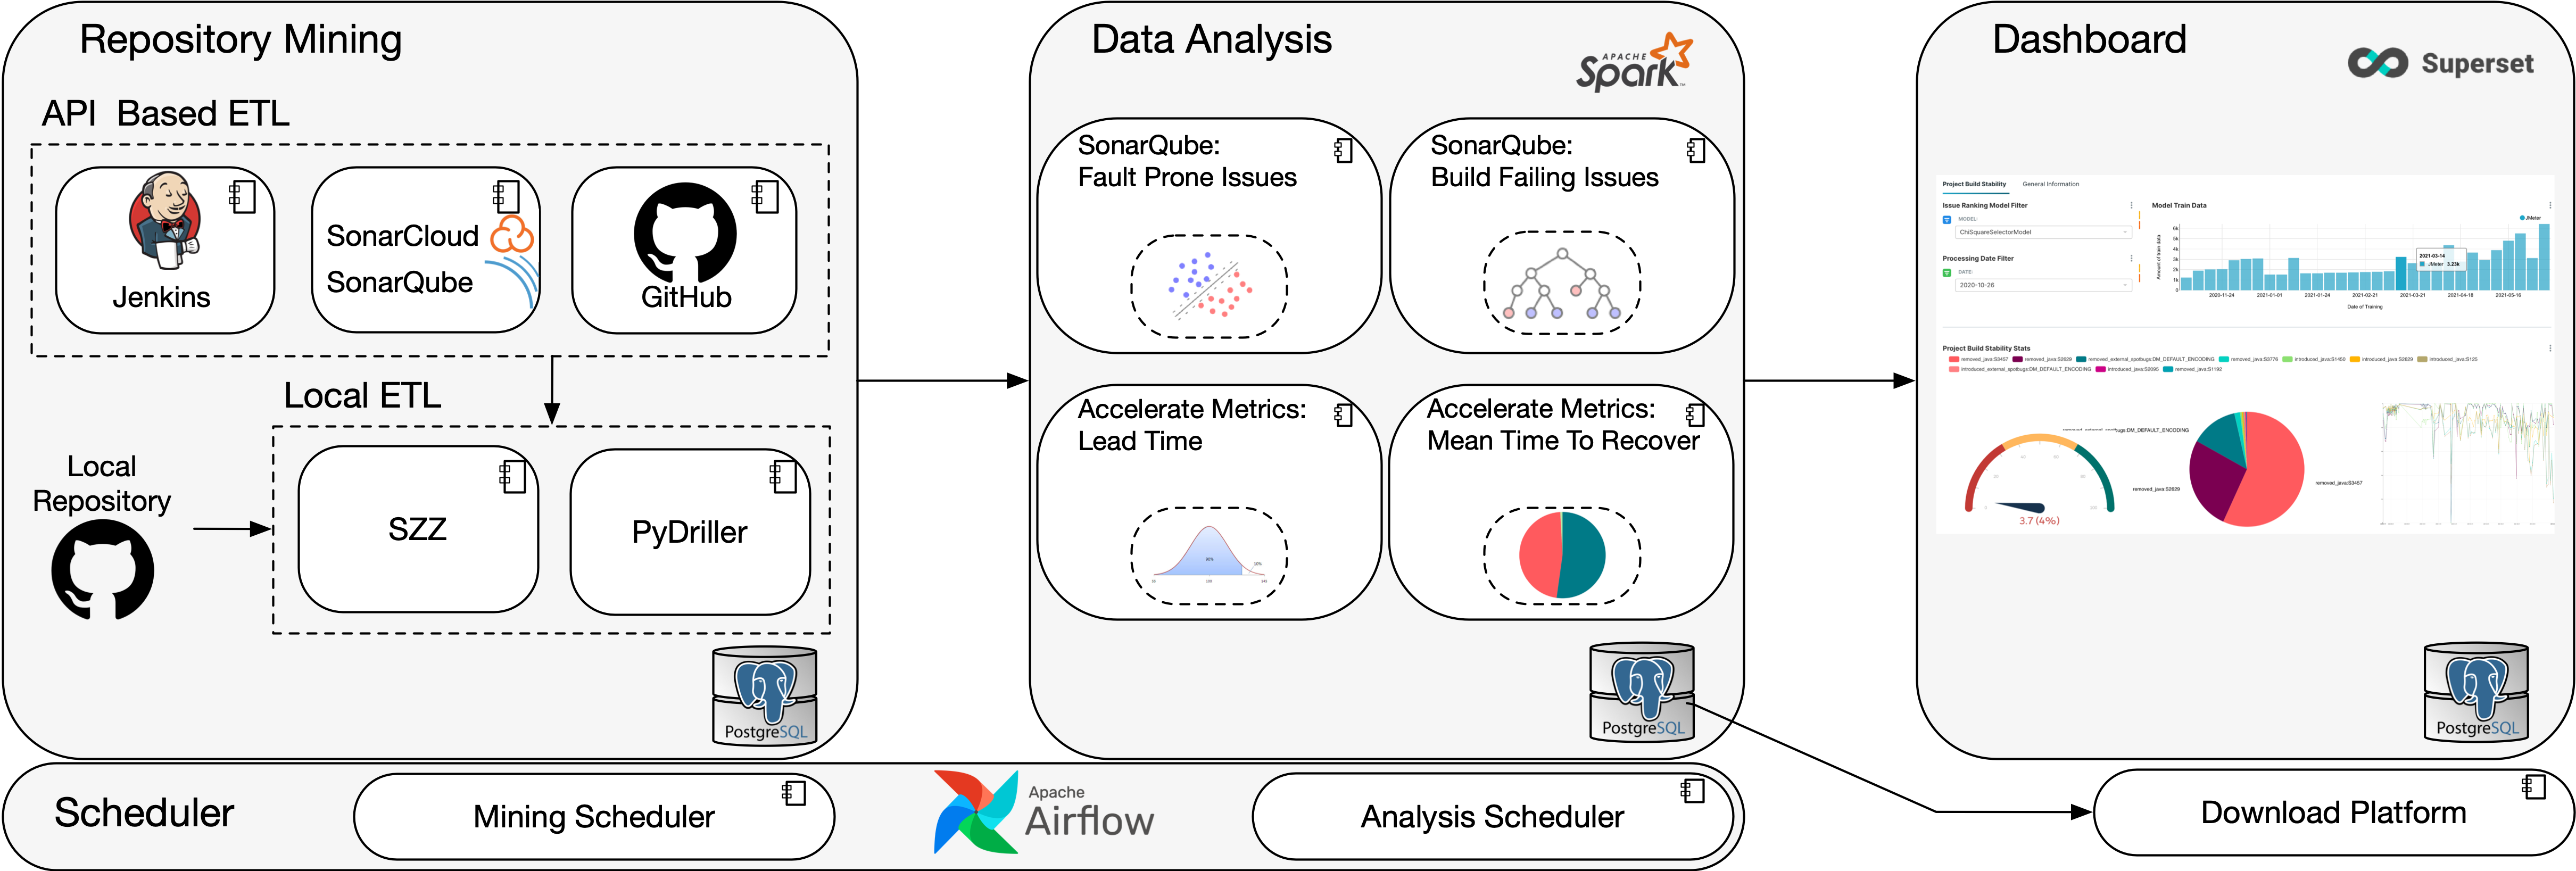
Pandora is a tool that automatically and continuously mines data from different existing tools and online platforms and enable to run and continuously update the results of MSR studies.
In details, Pandora provides different benefits to:
-
Continuous Dataset Mining. Pandora is designed to continuously mine data from repositories (e.g. GitHub), Issue trackers (e.g. Jira), and any online platform (e.g. SonarCloud).
-
Continuous application of custom Statistical and Machine Learning models. Researchers can upload their python scripts to analyze the data and schedule a training frequency (e.g. once a month).
-
Simple and replicable data analysis approach. Researchers do not need to know how the data is incrementally updated, they can simply use them.
-
Data Visualization. Dashboards for visualizing the results of the study
-
Dataset export for offline usage. Data scientist and researchers can easily download the lastest versions of the datasets for their empirical studies.
-
Mutual Platform for further integrations. Developers can build new plug-ins for other datasources, platforms or standalone tools (e.g. PyDriller) by integrating their ETL, analysis/processing pipelines, scheduling them with Airflow, sharing the same backend database and visualization tool.
Pandora is composed by four main components:
-
Data Extraction: aimed at Extracting information from repository, Transform and Load into the database (ETL). The process is based on ETL plugin that can be either API based, or executed on the locally cloned repositories.
-
Data Processing: enables to integrate data-analysis plugins that will be executed in Apache Spark, each using a specific methodology (Machine Learning/Statistical Analysis) to solve a specific task.
-
Dashboard: visualization tool based on Apache Superset , used for inspecting and visualize the data and the results of the analysis performed in the Data Analysis block.
-
Scheduler: based on Apache AirFlow, aimed to interact with the other blocks in order to schedule the execution of (i) the repository mining, and (ii) the training/fitting of the models used in the Data Analysis block.
-
Registration/Download Website: enable registering project repositories for analysis or downloading the collected datasets (the link can be found at the main dashboard info section)
.
├── README.md
├── config.cfg                  # General Configurations for the project
├── data_processing             # Spark Data Processing
├── db                          # Backend database
├── extractors                  # Extractor modules
├── images
├── installation_guide.md
├── requirements.txt            # Python env packages
├── scheduler                   # Apache Airflow tasks and DAGs
├── ui                          # Apache Superset exported templates
└── utils.py                    # Utilities consumed by all other parts
It is possible to import static datasets into the Visualization tool (Apache Superset). This gives users the opportunity to interactively visualize, analyze and find connections between their data and data readily available on the platform.
-
If you have a database, you can create a connection to your database by crafting a SQLAlchemy URI, then fill in necessary information at Data -> Databases -> Add a new record or follow this page.
-
Specify the tables you want to import. Go to Data -> Datasets or this page. You can simply specify a table using SQL, e.g
SELECT * FROM <TABLE_NAME>, or use a more complex SQL command to customize your view/table. -
If you have a CSV file. First, you need to create a backend database and wire it up with Superset (follow the Step 1). In the settings of the database, tick on Allow Csv Upload property, and specify schemas_allowed_for_csv_upload in the Extra section, e.g put "public". Now go to Data -> Upload a CSV or this page, fill in the settings to upload the CSV into a database.
