Ch18: Wrong version of "truncated-x-axis" graph
Opened this issue · 0 comments
halian-vilela commented
Hey guys!
I've just saw that the second graph of chapter 18, which should show a "correct" Y axis, in fact is starting from 10:
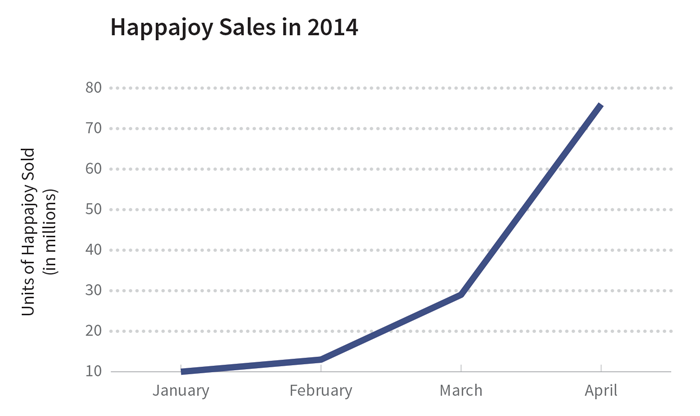
I've checked in the source code and it shows the correct version: https://github.com/infoactive/data-design/blob/master/images/sections/06/21-02_truncated-x-axis.png
But, for some reason, in the online version it shows another image.
It would be nice if someone could regenerate the site so that this wrong version gets replaced.
Thanks!