SPOT-RNA: RNA Secondary Structure Prediction using an Ensemble of Two-dimensional Deep Neural Networks and Transfer Learning.
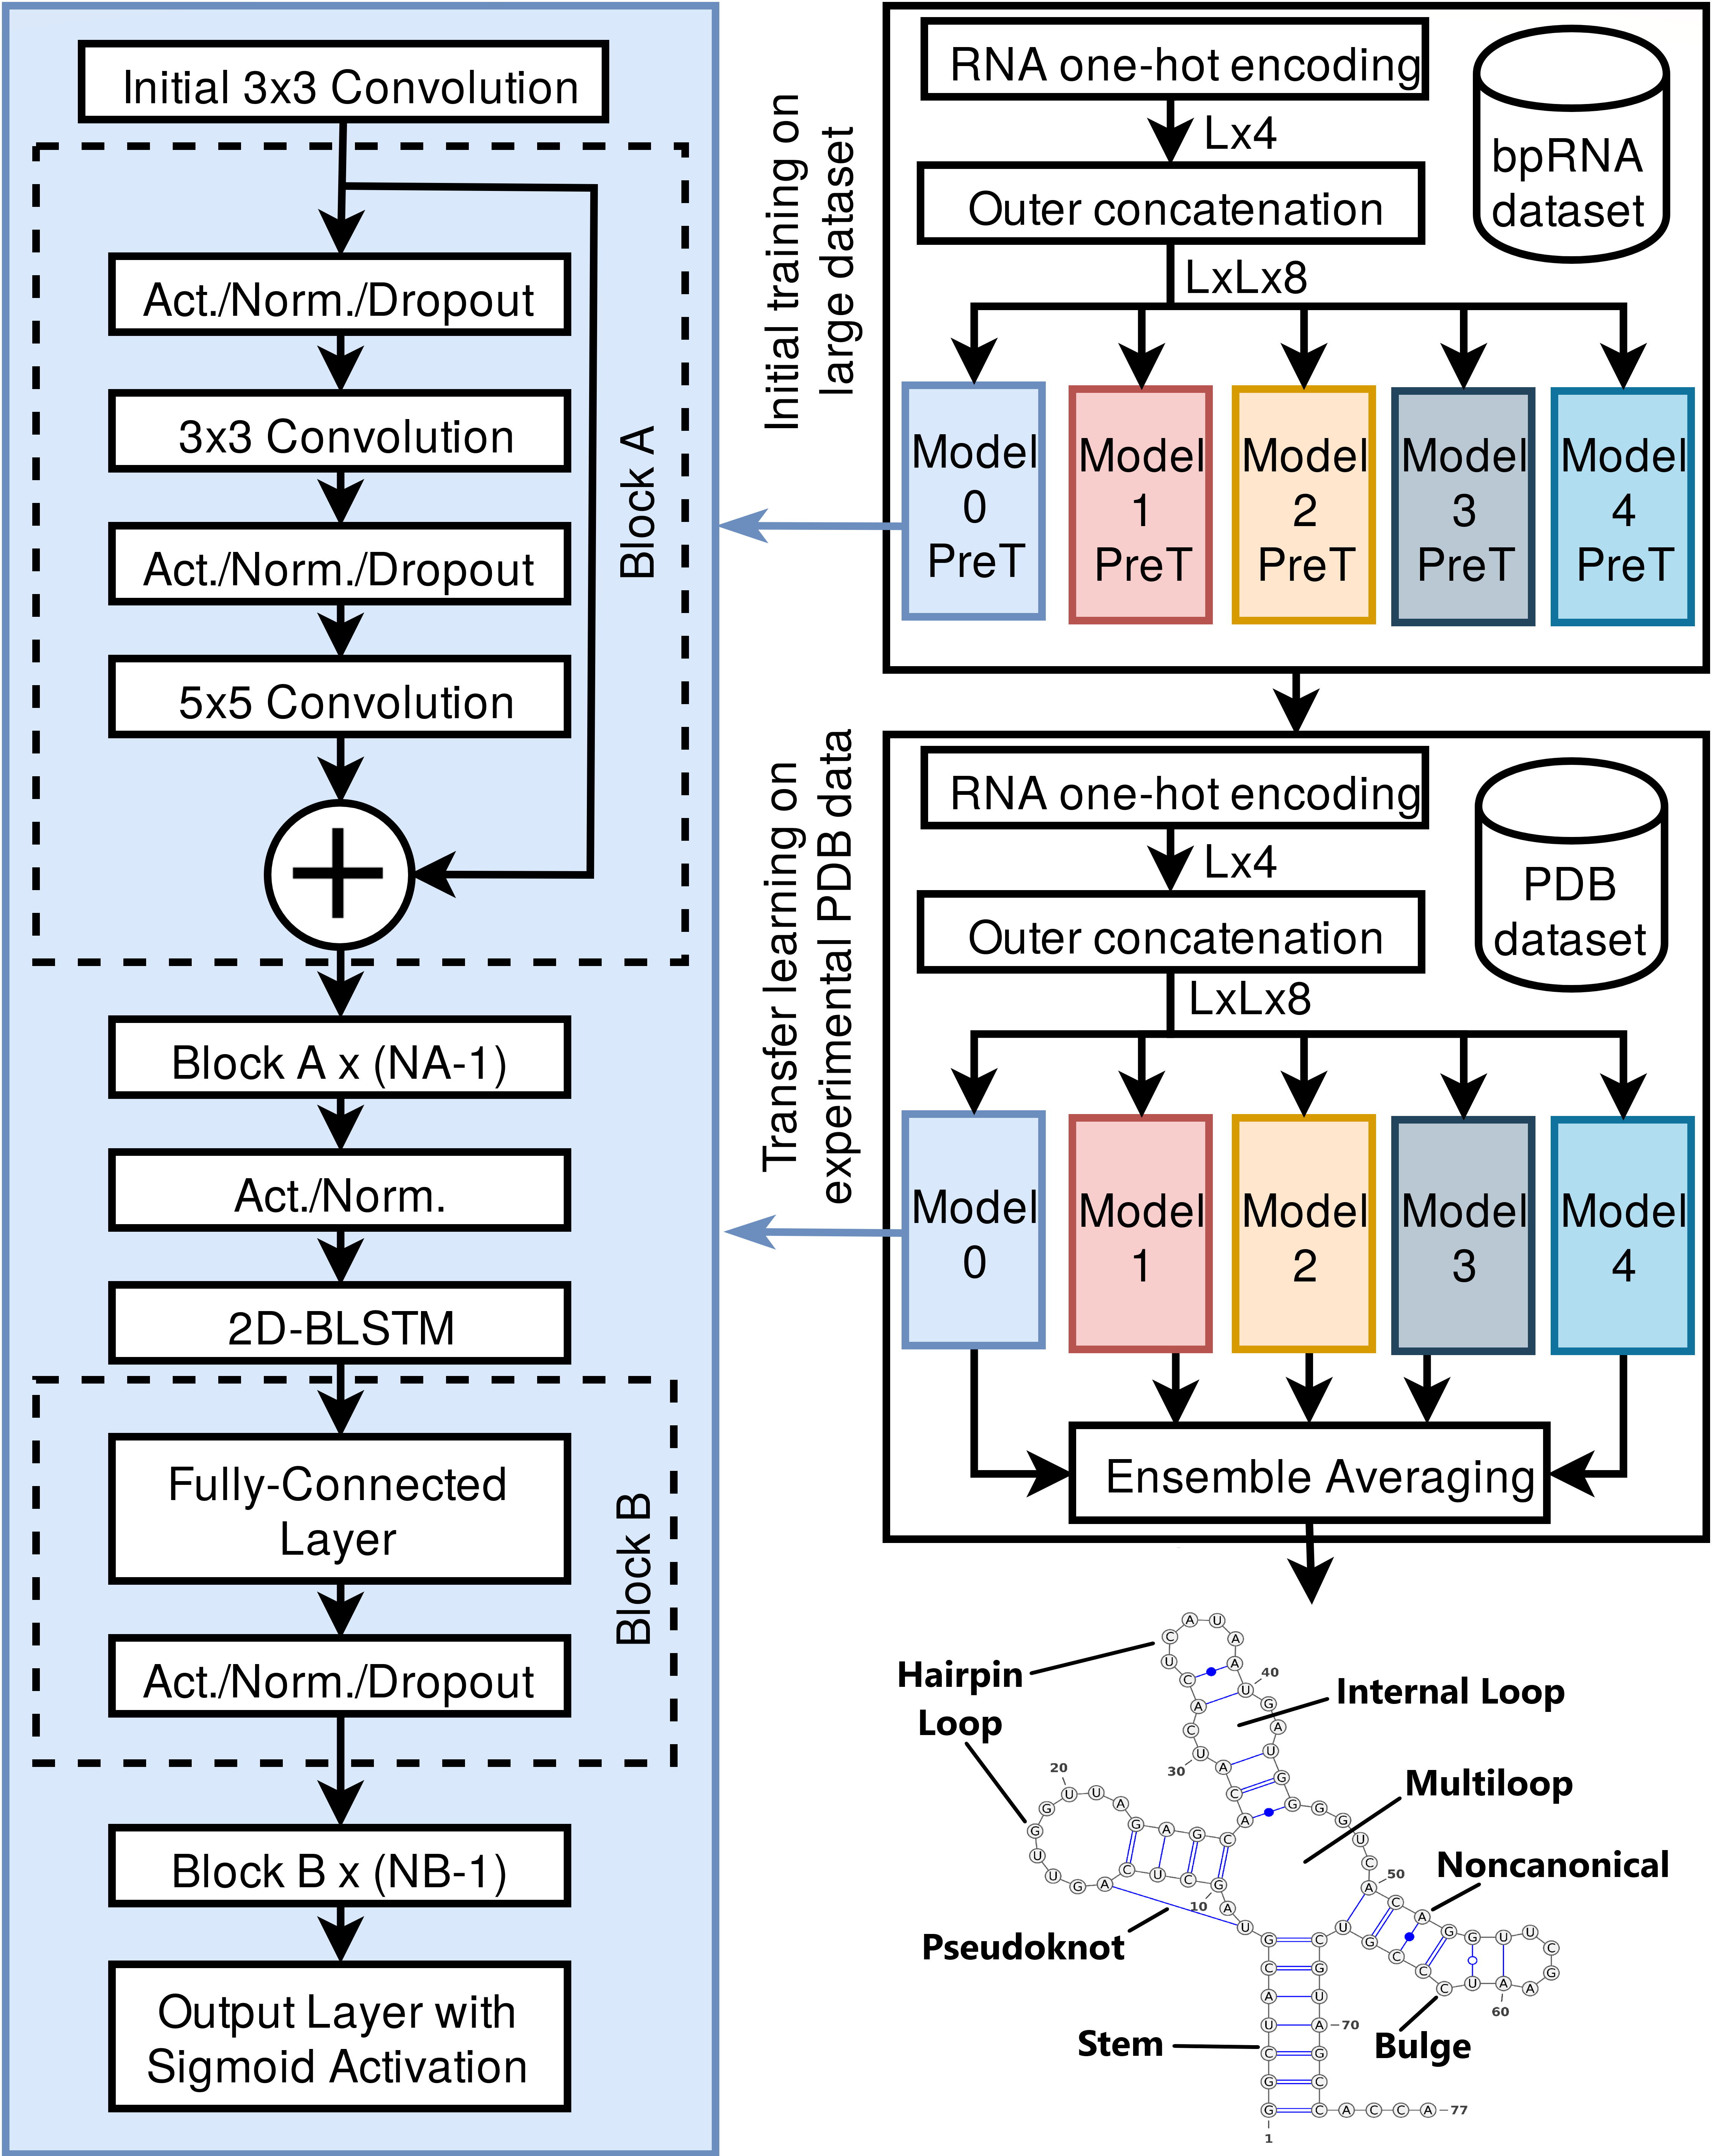
The majority of our human genome transcribes into noncoding RNAs with unknown structures and functions. Obtaining functional clues for noncoding RNAs requires accurate base-pairing or secondary-structure prediction. However, the performance of such predictions by current folding-based algorithms has been stagnated for more than a decade. Here, we propose the use of deep contextual learning (Figure 1) for base-pair prediction including those noncanonical and non-nested (pseudoknot) base pairs stabilized by tertiary interactions. Since only less than 250 nonredundant, high-resolution RNA structures[2] are available for model training, we utilize transfer learning from a model initially trained with a recent high-quality bpRNA[1] dataset of >10,000 nonredundant RNAs made available through comparative analysis.
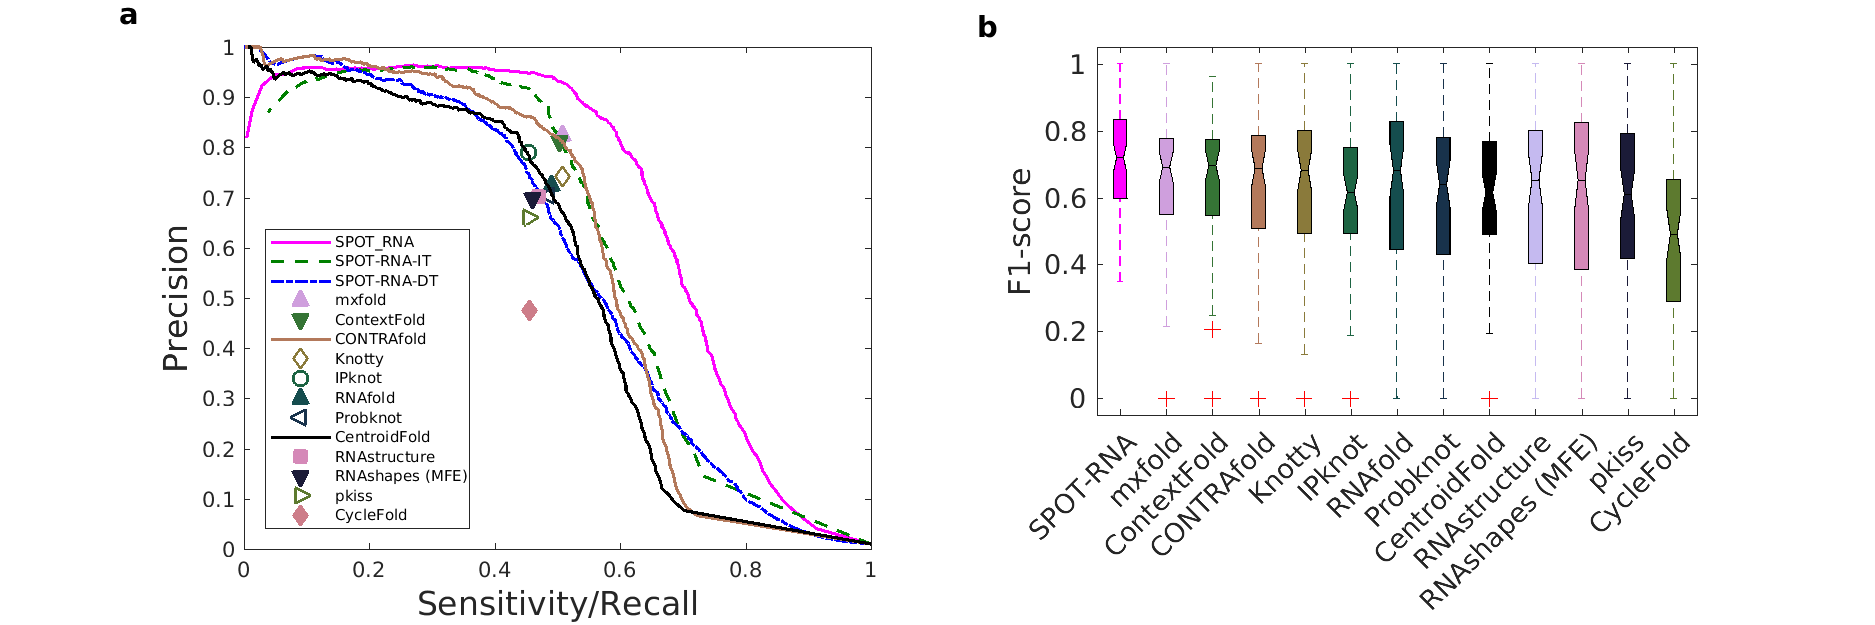
The resulting method (SPOT-RNA) achieves 94% precision at 50% sensitivity (Figure 2). Furthermore, it improves F1-score by a respective 53% and 60% over existing techniques in predicting noncanonical and non-nested base pairs. SPOT-RNA is also available as web-server at https://sparks-lab.org/server/spot-rna/. The web-server provides an arc diagram and a 2D diagram of predicted RNA secondary the structure through Visualization Applet for RNA (VARNA)[3] tool along with a dot plot of SPOT-RNA predicted base-pair probabilities.
Hardware Requirments: SPOT-RNA predictor requires only a standard computer with around 16 GB RAM to support the in-memory operations for RNAs sequence length less than 500.
Software Requirments:
- Python3
- virtualenv or Anaconda
- CUDA 10.0 (Optional If using GPU)
- cuDNN (>= 7.4.1) (Optional If using GPU)
SPOT-RNA has been tested on Ubuntu 14.04, 16.04, and 18.04 operating systems.
To install SPOT-RNA and it's dependencies following commands can be used in terminal:
git clone https://github.com/jaswindersingh2/SPOT-RNA.gitcd SPOT-RNAwget 'https://www.dropbox.com/s/dsrcf460nbjqpxa/SPOT-RNA-models.tar.gz' || wget -O SPOT-RNA-models.tar.gz 'https://app.nihaocloud.com/f/fbf3315a91d542c0bdc2/?dl=1'tar -xvzf SPOT-RNA-models.tar.gz && rm SPOT-RNA-models.tar.gz
Either follow virtualenv column steps or conda column steps to create virtual environment and to install SPOT-RNA dependencies given in table below:
| virtualenv | conda | |
|---|---|---|
| 5. | virtualenv -p python3.6 venv |
conda create -n venv python=3.6 |
| 6. | source ./venv/bin/activate |
conda activate venv |
| 7. | To run SPOT-RNA on CPU:pip install tensorflow==1.14.0 or To run SPOT-RNA on GPU: pip install tensorflow-gpu==1.14.0 |
To run SPOT-RNA on CPU:conda install tensorflow==1.14.0 or To run SPOT-RNA on GPU: conda install tensorflow-gpu==1.14.0 |
| 8. | pip install -r requirements.txt |
while read p; do conda install --yes $p; done < requirements.txt |
For single sequence:
python3 SPOT-RNA.py --inputs sample_inputs/single_seq.fasta --outputs 'outputs/' --cpu 32
The output come of above command will be three files (.bpseq, .ct, and .prob) in 'outputs' folder. The '.bpseq' and '.ct' file is the standard format to represent RNA secondary structure. '.prob' file consists of the base-pair probability of predicted secondary structure by SPOT-RNA which can be useful for plotting PR-curve and to check the confidence of predicted base-pair.
For batch of sequences:
python3 SPOT-RNA.py --inputs sample_inputs/batch_seq.fasta --outputs 'outputs/'
To run on GPU:
SPOT-RNA can be run on GPU by setting '--GPU' argument to GPU's number in the system. Specify '0' if only a single GPU is available. Running SPOT-RNA on GPU reduces the computation time of prediction by almost 15 times.
python3 SPOT-RNA.py --inputs sample_inputs/batch_seq.fasta --outputs 'outputs/' --gpu 0
2D plots of predicted secondary structure:
To get the 2D plots of SPOT-RNA output, VARNA[3] tool is used. Please refer to http://varna.lri.fr/ for detailed information about this tool. To run this tool, please make sure Java plugin version >= 1.6 is installed in the system. To check whether java is installed or not, the following command can be used.
java -version
If java is not installed above command will not show anything. To install java in the system following command can be used.
sudo apt install default-jre && sudo apt install openjdk-11-jre-headless
After java install, the following command can be used to get SPOT-RNA output with 2D plots of predicted secondary structure.
python3 SPOT-RNA.py --inputs sample_inputs/single_seq.fasta --outputs 'outputs/' --plots True
The output of the above command will generate two additional files (arc plot and 2D plot of predicted secondary structure) along with '.bpseq', '.ct', and '.prob' files in 'outputs' folder.
Secondary structure motifs from predicted structure:
To get the secondary structure motifs (stem, helix, loops etc) and predicted output in Vienna (dot-bracket) format, SPOT-RNA used the software tool from bpRNA[1]. Please refer to https://github.com/hendrixlab/bpRNA for detailed information about this tool. To run this script, please make sure 'Graph.pm' module (https://metacpan.org/pod/Graph) of Perl is installed in the system. To check whether 'Graph' module already installed or not, use the following command:
perl -e 'use Graph;'
If the output of this command looks like 'Can't locate Graph.pm in @INC (you may need to install the Graph module) (@INC contains: .........' then the following command can be used to install this module:
sudo apt install cpanminus && sudo cpanm Graph
After the 'Graph' module install, the following command can be used to get SPOT-RNA output with secondary structure motifs:
python3 SPOT-RNA.py --inputs sample_inputs/single_seq.fasta --outputs 'outputs/' --plots True --motifs True
The output of the above command will generate one additional file '.st' in 'outputs' folder.
The following datasets were used for Initial Training:
- bpRNA[1]: Initial Learning (Training TR0, validation VL0, and test TS0)
Dropbox or Nihao Cloud
The following datasets were used for Transfer Learning:
- PDB[2]: Transfer Learning (Training TR1, validation VL1, and test TS1)
Dropbox or Nihao Cloud
If you use SPOT-RNA for your research please cite the following papers:
Singh, J., Hanson, J., Paliwal, K., Zhou, Y. RNA secondary structure prediction using an ensemble of two-dimensional deep neural networks and transfer learning. Nat Commun 10, 5407 (2019) https://doi.org/10.1038/s41467-019-13395-9
If you use SPOT-RNA data sets and/or post-processing (2D plots, structural motifs from SPOT-RNA output) pipeline, please consider citing the following papers:
[1] Padideh Danaee, Mason Rouches, Michelle Wiley, Dezhong Deng, Liang Huang, David Hendrix, bpRNA: large-scale automated annotation and analysis of RNA secondary structure, Nucleic Acids Research, Volume 46, Issue 11, 20 June 2018, Pages 5381–5394, https://doi.org/10.1093/nar/gky285
[2] H.M. Berman, J. Westbrook, Z. Feng, G. Gilliland, T.N. Bhat, H. Weissig, I.N. Shindyalov, P.E. Bourne. (2000) The Protein Data Bank Nucleic Acids Research, 28: 235-242.
[3] VARNA: Interactive drawing and editing of the RNA secondary structure Kévin Darty, Alain Denise and Yann Ponty Bioinformatics, pp. 1974-1975, Vol. 25, no. 15, 2009
Mozilla Public License 2.0
jaswinder.singh3@griffithuni.edu.au, yaoqi.zhou@griffith.edu.au

