


![]()

Analyze architecture of spatially distributed objects.
This plugins aims to make methods for spatial statistics available in Napari. Common usecases for spatial statistics are described in this paper. In brief, methods of spatial statistics allow to answer questions like the following:
- Single type of objects in space: Do the objects appear clustered together or are they randomly scattered throughout space?
- Two or multiple types of objects: Does object of typa A appear within the neighborhood of tybe B objects more often than what we would expect from randomly distributed objects?
Napari-spatial-statistics currently allows analyzing spatial distributions of point and image layers in Napari. This tutorial describes a typical workflow for either image type and analysis:
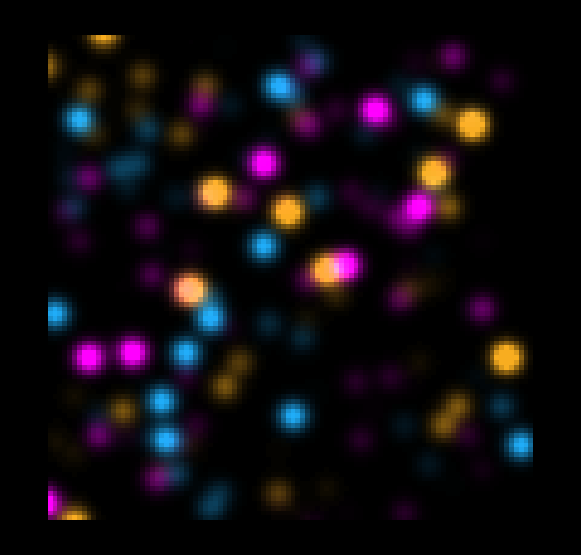
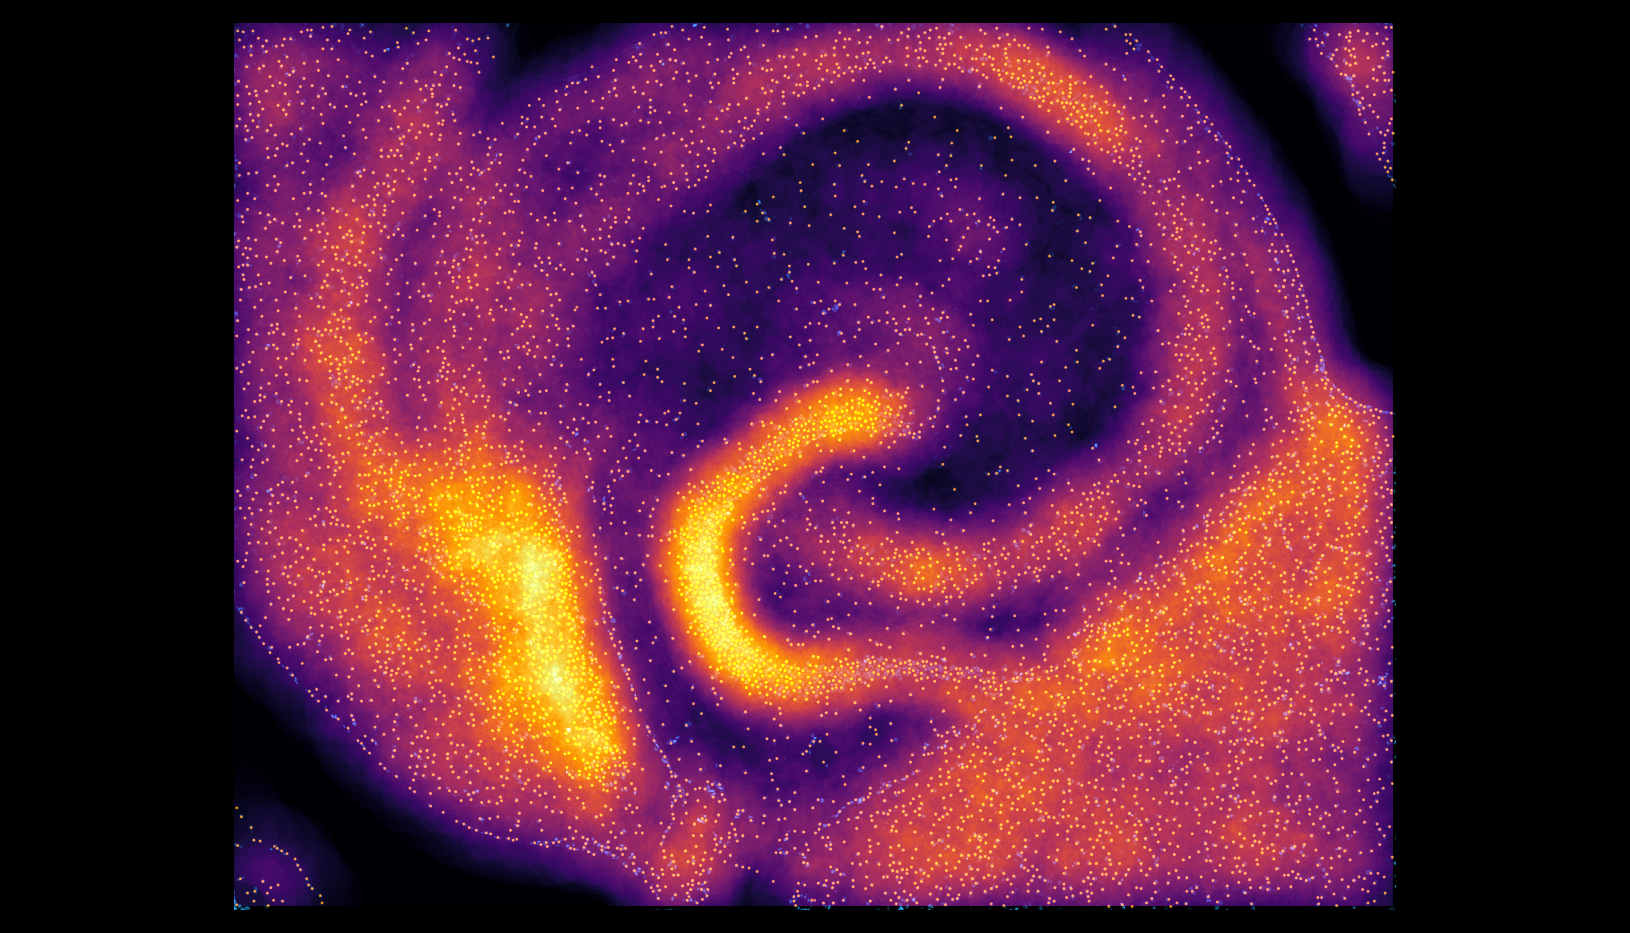
| Points layer data | Image layer data | |
|---|---|---|
| Neighborhood enrichment test | 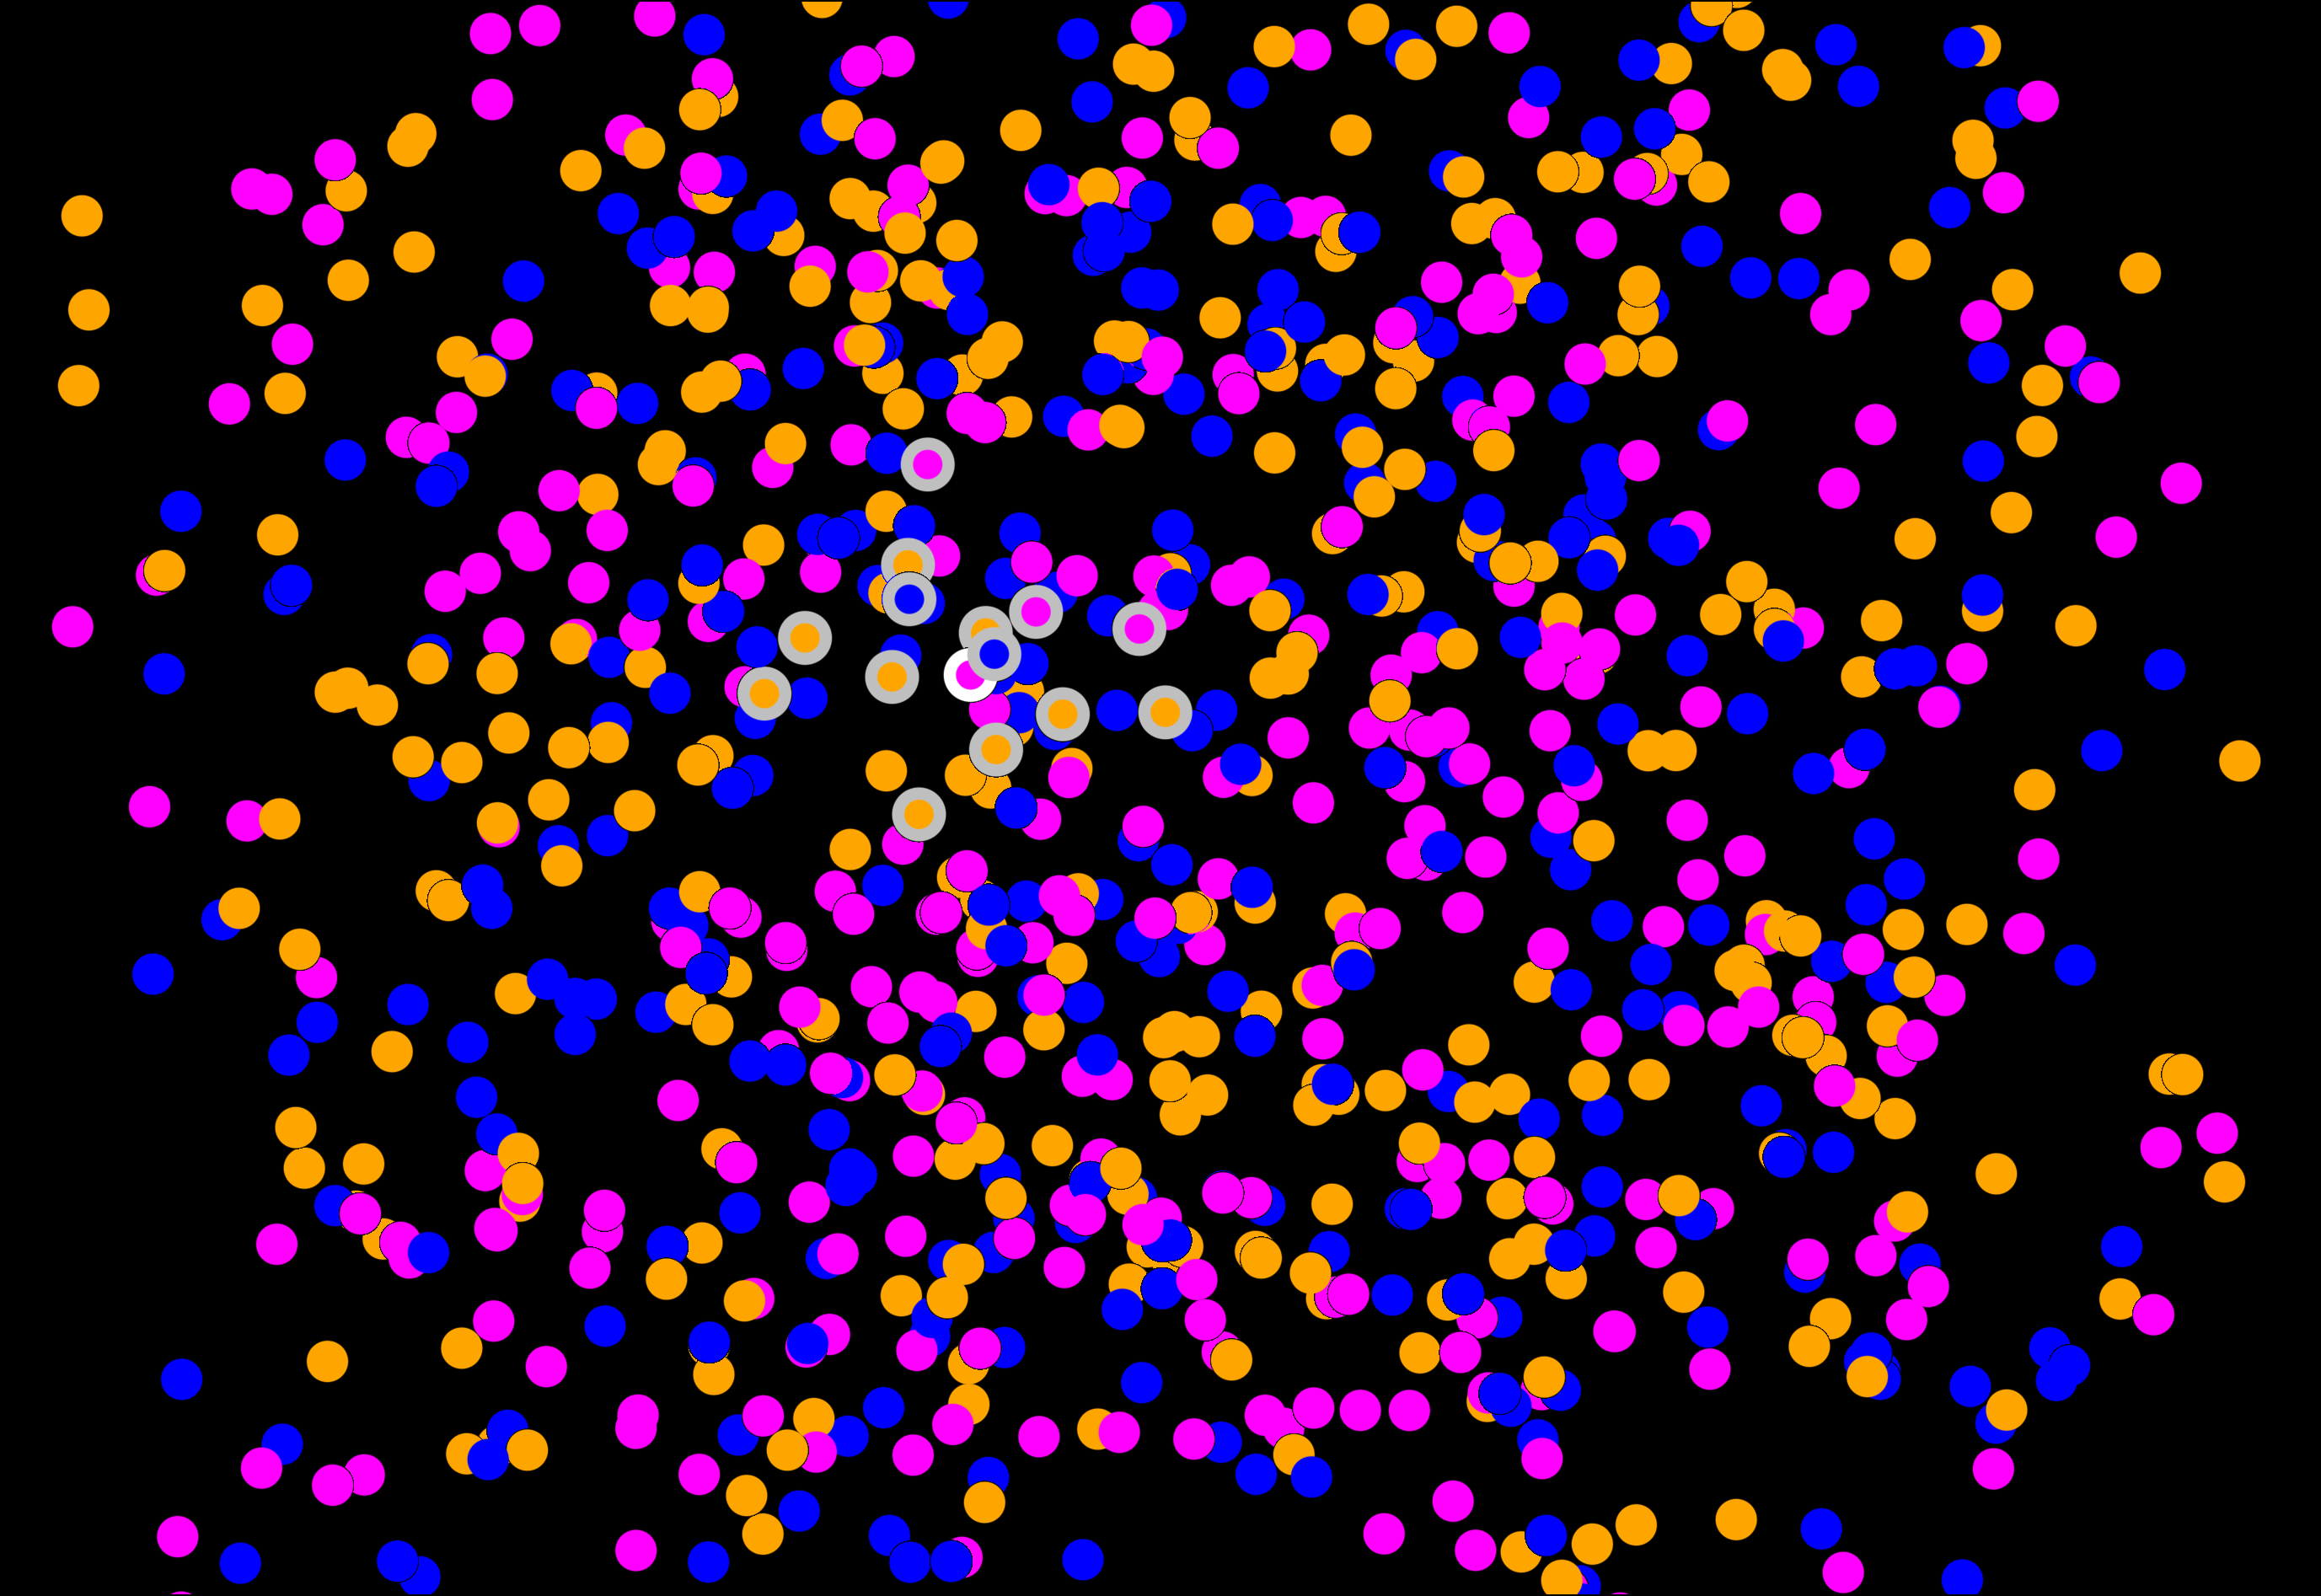 |
 |
| Density maps | 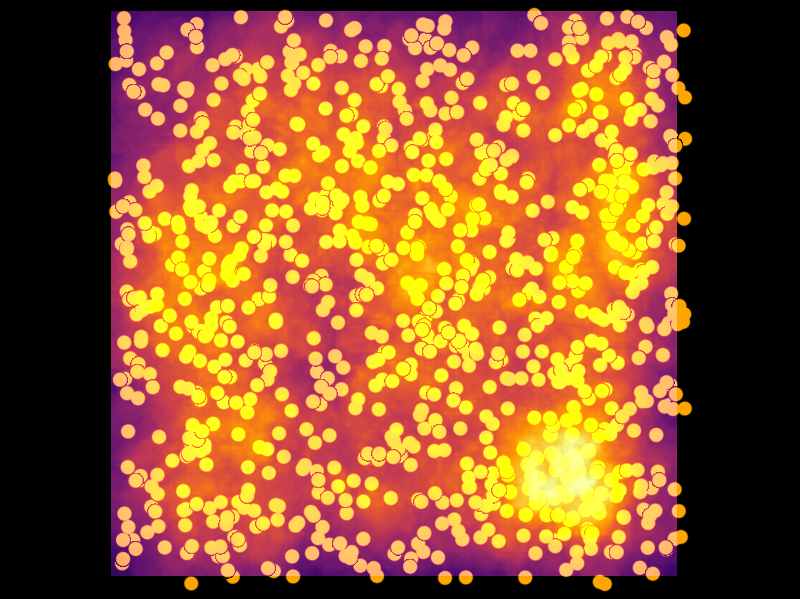 |
 |
- Cluster co-occurence statistics
- Ripley's functions
- Newman's assortativity
- Native integration with label layers
This napari plugin was generated with Cookiecutter using @napari's cookiecutter-napari-plugin template.
If you haven't already done so, create a new environment for Napari with:
conda create -n napari-spatial-statistics Python=3.9
conda activate napari-spatial-statistics
Install a few packages with conda:
conda install -c conda-forge napari h5py pytables
Finally, install napari-spatial-statistics via pip:
pip install napari-spatial-statistics
To install latest development version :
pip install git+https://github.com/jo-mueller/napari-spatial-statistics.git
Contributions are very welcome. Tests can be run with tox, please ensure the coverage at least stays the same before you submit a pull request.
Distributed under the terms of the BSD-3 license, "napari-spatial-statistics" is free and open source software
If you encounter any problems, please file an issue along with a detailed description.