This code was created in the writing of a master thesis and paper on the impact that the COVID-19 related lockdown measures during spring 2020 had on air pollution. The resulting paper can be found here: https://arxiv.org/abs/2011.10144
This respository contains code and examples to (1) train a long-term air pollution prediction model with weather variables, (2) estimate the impact of COVID-19 related lockdowns on air pollution and (3) investigate the air pollution reduction potential in traffic. It can be applied to datasets for different countries.
These notebooks can be run using .
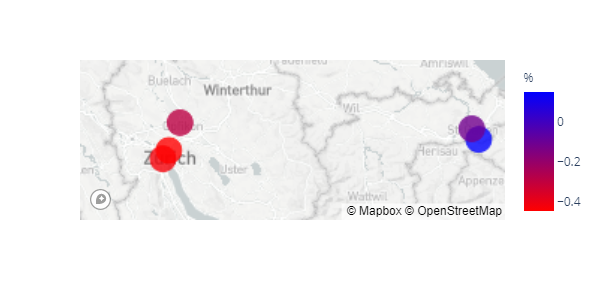
In order to run these scripts you need a dataset containing daily observations of the air pollutant you want to investigate (e.g. NO2, PM2.5), and the weather variables windspeed, wind direction, humidity and temperature. Additional weather data can easily be incorporated. For demonstration purposes, you can find data for 5 stations in East Switzerland in this repository (Raw Swiss Data). Besides these variables the model uses additional lagged versions, long-term averages and other derivative variables. These can be calculated using the Generate Variables Notebook.
To predict air pollution concentrations we use a Generalized Additive Model. In order to make the decision which variables to include in the model, a model selection algorithm is used. The algorithm is explained in more detail and implemented in Model Selection.
The selected models (one for every station) are then trained on data before the COVID-19 Lockdown (pre-LD model). The trained model is evaluated using cross validation. Training and evaluation are performed in Model Evaluation.
In the script Change Estimation Transfer the following operations are implemented:
In the next step, the trained model is used to predict air pollution during the lockdown period (Lockdown Dates for Austria, Switzerland & China are specified in the file Dictionaries, sources are given in the paper). The difference to the observed values can be used as an estimate for the change of air pollution levels during the lockdown period.
The timeframe of the lockdowns (usually about 1 month) is too short to train a seperate GAM model on the data. However, we can create a model for the lockdown period (LD-model) using transfer learning, i.e. we keep all relationships between the pollutant and the weather variables fixed (it can be assumed that the influence of weather on pollution will not change significantly within one month) but do retraining for the variable 'weekday' which is used as a proxy for traffic.
To evaluate the performance of the lockdown model we again perform cross validation with a 3 day time periods as test sets.
We further use the pre-LD model and the LD model to predict the period after the lockdown. These estimates can be used to infer how much a city has gone 'back-to-normal'.
Using the LD-model we make 'predictions' for the whole year of 2019, thus it can be estimated how air pollution levels would have changed if the city had been under lockdown for a whole year.
The outputs of all this scripts can be visualised using the Plots script. It contains code to obtain the following statistics and graphics
Summarizes the outcome of the model selection algorithm, grouping of the variables can be inferred from Dictionaries.
Whisker plot that shows the model performance in cross validation for different test training set length + overview of model evaluation statistics.
Boxplot that compares weather conditions in 2019 and 2020 during the time period of the lockdown.
Summary table of observed pollutant values in 2020 during the lockdown, prediction of the pre-LD model, the dummy prediction (i.e. when not including the weekday variable), the LD-model prediction and the observed values of the pollutant in 2019 during the same time period.
Time Series Plot of observed values 2020, observed values 2019, LD model prediction and pre-lD model prediction for different classes of stations (classification can be found in Dictionaries.
True values, pre-LD model estimates and LD model estimates for the whole year 2019.
Johanna Einsiedler johanna_einsiedler@gmx.at | Olga Saukh saukh@tugraz.at | Yun Cheng chengyu@ethz.ch | Franz Papst papst@csh.ac.at

