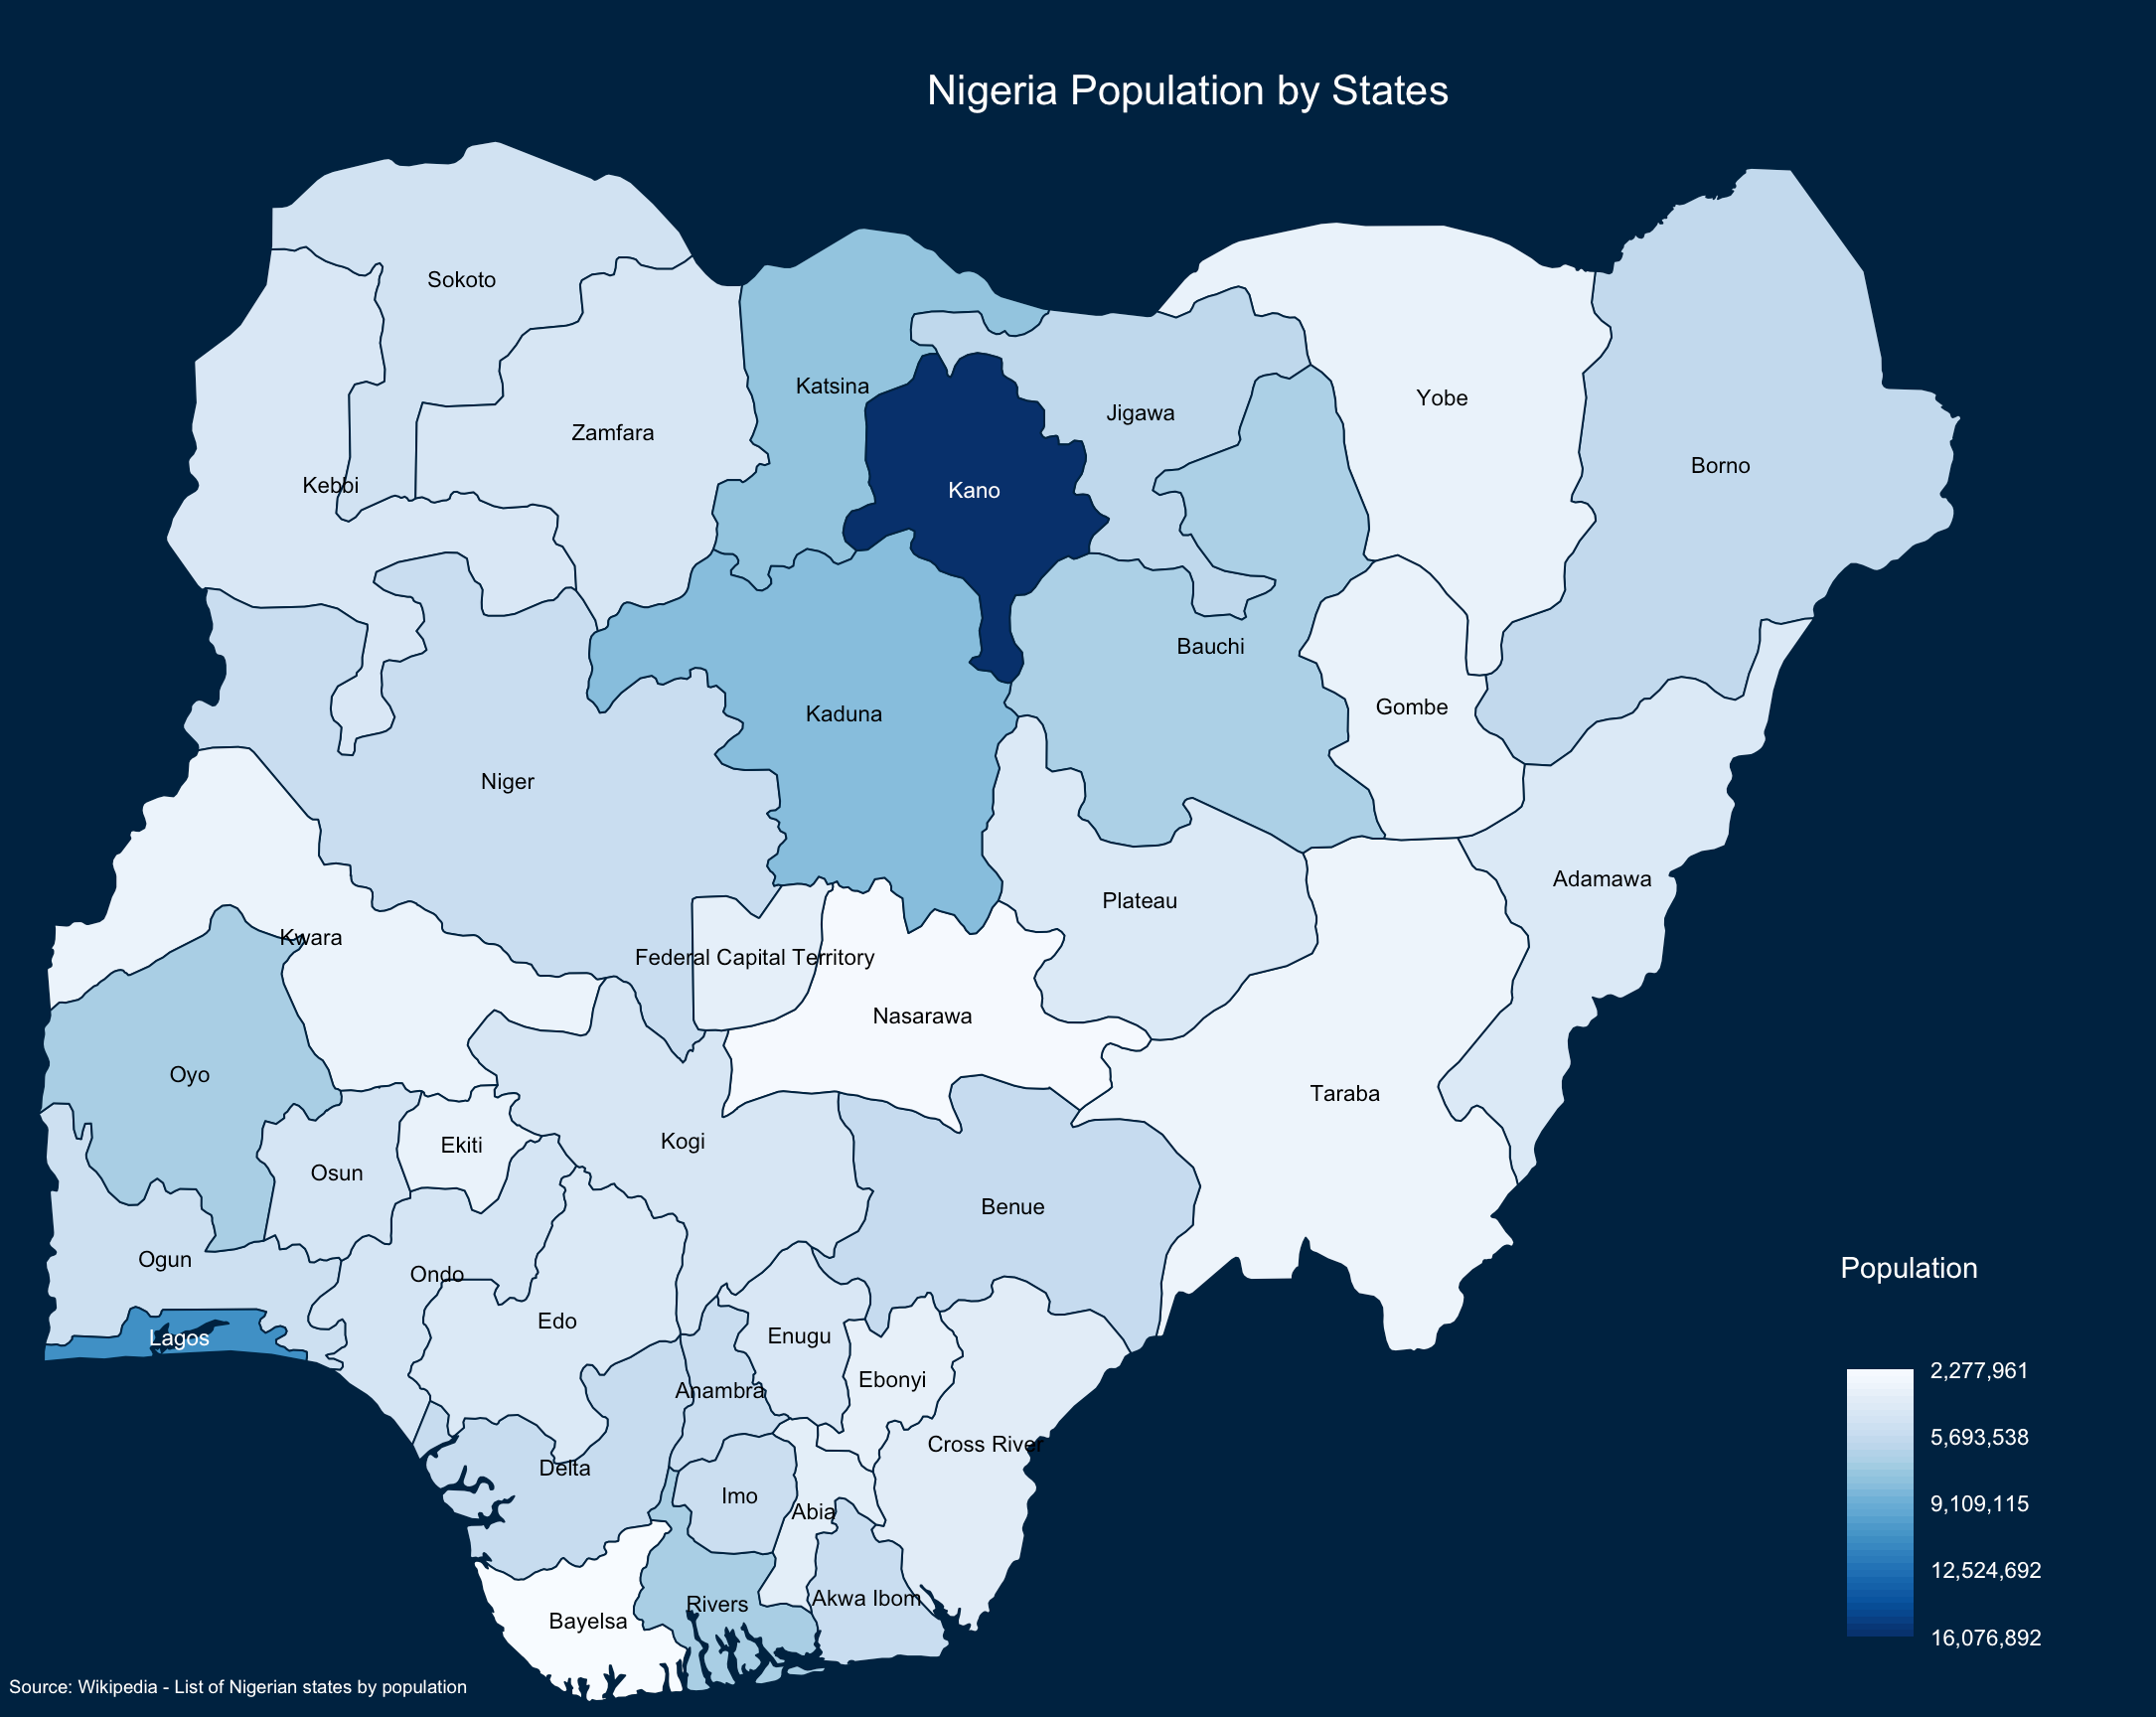
Materials for R-Ladies Abuja geospatial visualization workshop
Slides: https://ramikrispin.github.io/gis-dataviz-workshop/#1
- Introduction to spatial data
- Working with sf objects
- Plot
sfobjects with mapview, tmap, and ggplot2 - Create choropleth maps
In this workshop we will use the following packages:
- GIS data:
- rnaturalearth - provides access for the Natural Earth. The Natural Earth is a public domain map dataset including vector country and other administrative boundaries
- sf - for setting the map object class and plot it
- Tools for plotting maps:
- mapview - A wrapper for the leaflet library
- tmap - A package for creating a thematic maps
- ggplot2 - Is a system for declarative creating graphics
- viridis - A package that provide a series of color maps
- Datasets:
- coronavirus to pull Covid19 data at different levels (e.g., region, country, etc.)
- Books:
- Geocomputation with R - https://geocompr.robinlovelace.net/
- Geospatial Health Data: Modeling and Visualization with R-INLA and Shiny - https://www.paulamoraga.com/book-geospatial/
- Introduction to Spatial Data Programming with R - https://geobgu.xyz/r/
- Package documentation:
- sf - https://r-spatial.github.io/sf/
- rnaturalearth - https://docs.ropensci.org/rnaturalearth/
- mapview - https://r-spatial.github.io/mapview/
- tmap - https://r-tmap.github.io/tmap/
- ggplot2 (geom_sf) - https://ggplot2.tidyverse.org/reference/ggsf.html
- Examples
- Geospatial Visualization (coronavirus package) - https://ramikrispin.github.io/coronavirus/articles/geospatial_visualization.html
- Geospatial Visualization of the Covid19 Cases (covid19sf package) - https://ramikrispin.github.io/covid19sf/articles/geo.html
- Visualization covid19italy with Choropleth Maps (covid19italy package) - https://ramikrispin.github.io/covid19Italy/articles/geospatial_visualization.html
