The Azure Monitor data source now supports multiple dimensions for time series queries. This allows you to group by multiple parameters when previously you could group by one one.
Previously before 7.1, Azure Monitor Metric and Application Insights Services' query editors would allow only one dimension per query.
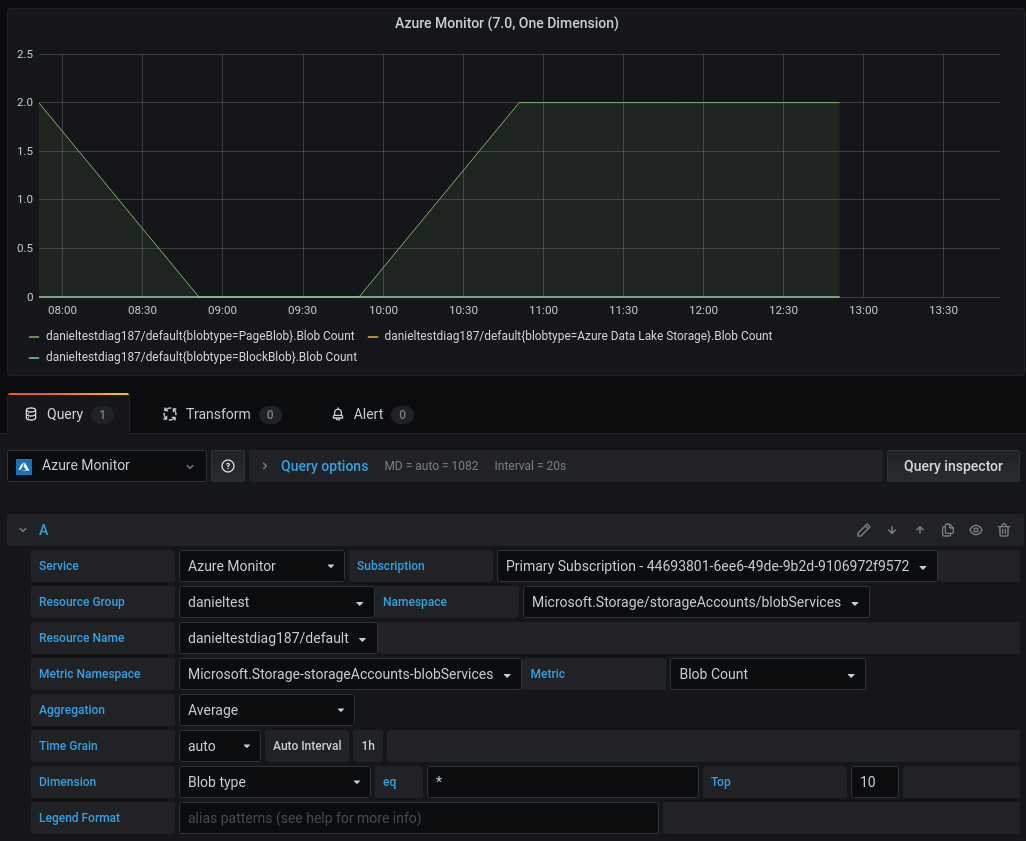
For example, with Azure Monitor Metrics and the blobServices' "Blob Count" metric, you could only select "Blob Type" or "Tier":
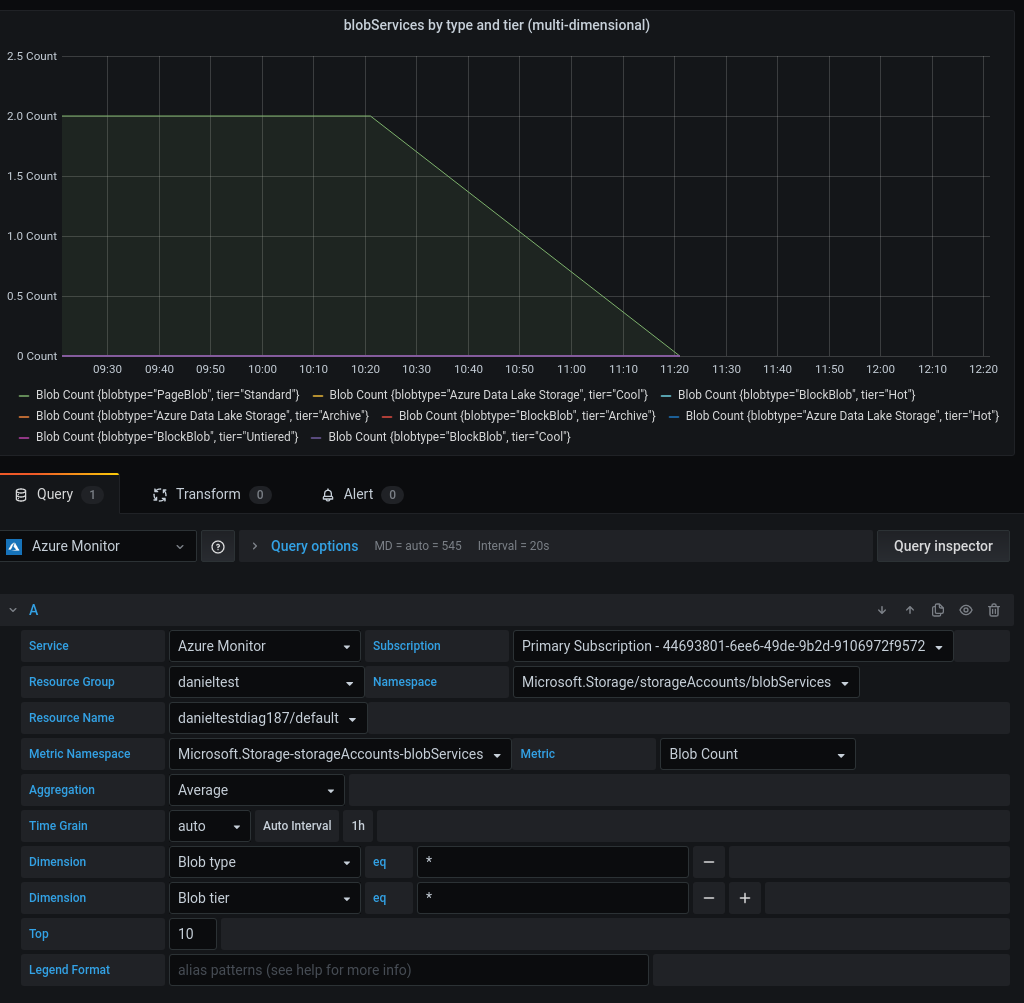
As of 7.1, multiple dimensions may be selected, as in this example, both "Blob Type" and "Tier":
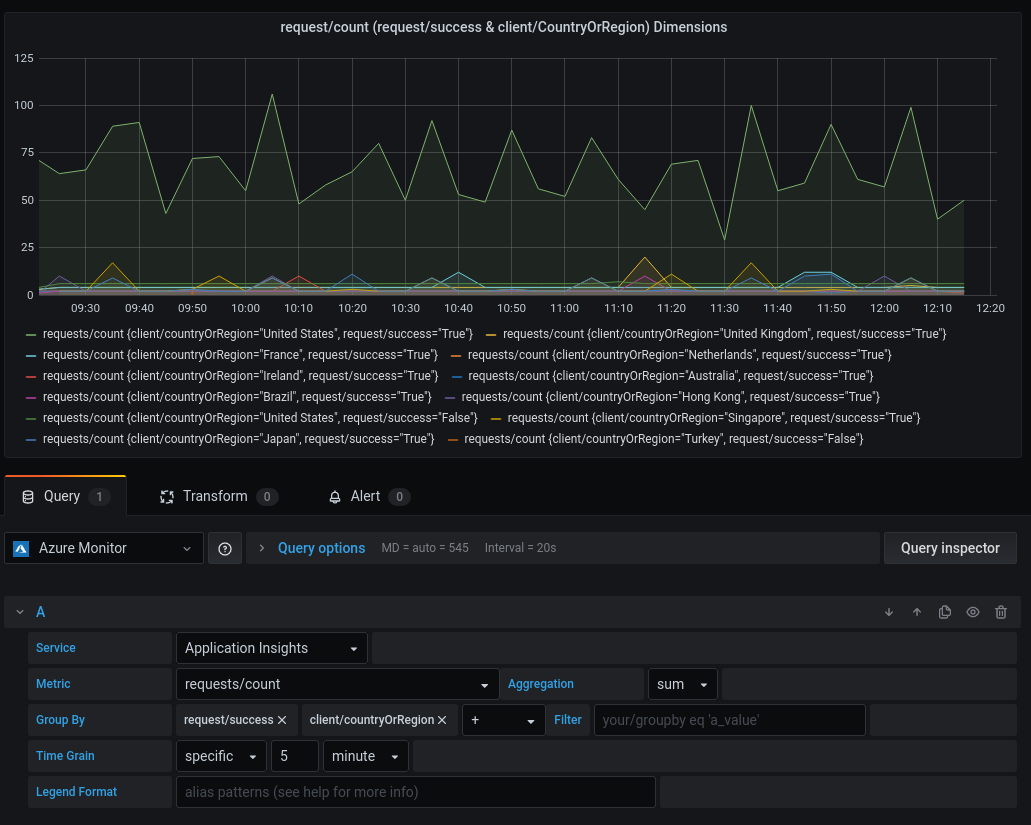
Application Insights had the same limitation, but now also supports multiple dimensions as seen in the following example with both the "client/countryOrRegion and "request/success" dimensions:
Before 7.1, when creating time series queries (by selecting "Format As" to "Time series"), the final result could have only one Number (metric) column and one Dimension (non-number) column to create a time series result for Log Analytics and Application Insights Analytics.
Since both of these Azure services are based on the Kusto query language, Application Insights Analytics has been moved to its own service the behaves the same way as Log analytics in 7.1.
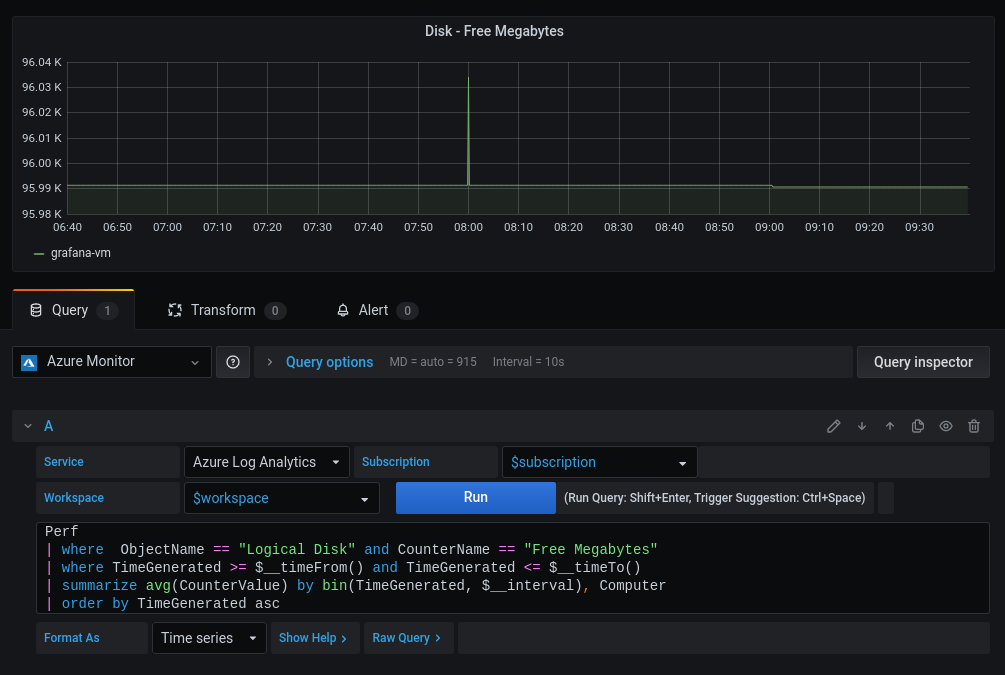
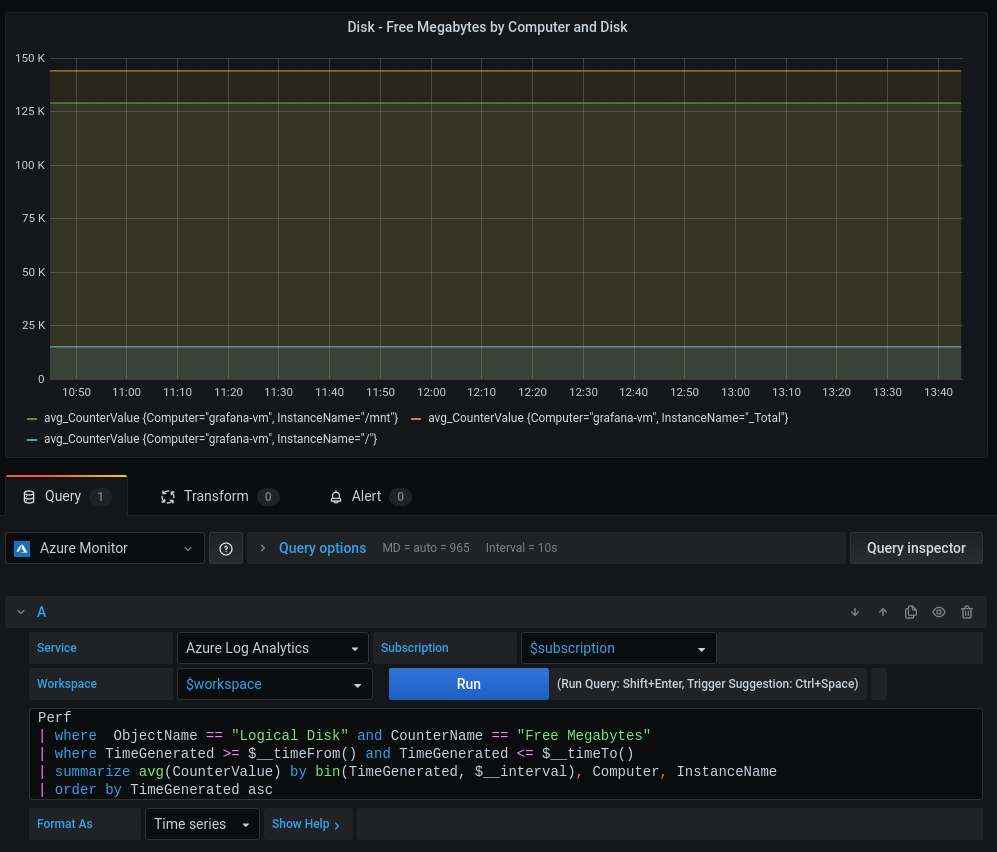
For example, the following query works before 7.0, and returns one time series per Computer, where Computer is considered a dimension.
Perf
| where  ObjectName == "Logical Disk" and CounterName == "Free Megabytes"
| where TimeGenerated >= $__timeFrom() and TimeGenerated <= $__timeTo()
| summarize avg(CounterValue) by bin(TimeGenerated, $__interval), Computer
| order by TimeGenerated ascSince 7.1, the summarize line can be changed to include more dimensions, such as adding InstanceName to the summarize statement from the previous query:
| summarize avg(CounterValue) by bin(TimeGenerated, $__interval), Computer, InstanceNameIt is also possible to query multiple metrics in a single query, or multiple metrics and multiple dimensions. This is a more advanced, and less common use case, as it can return a large number of series. But it can be useful, in particular with dashboard queries to use results in other panels.
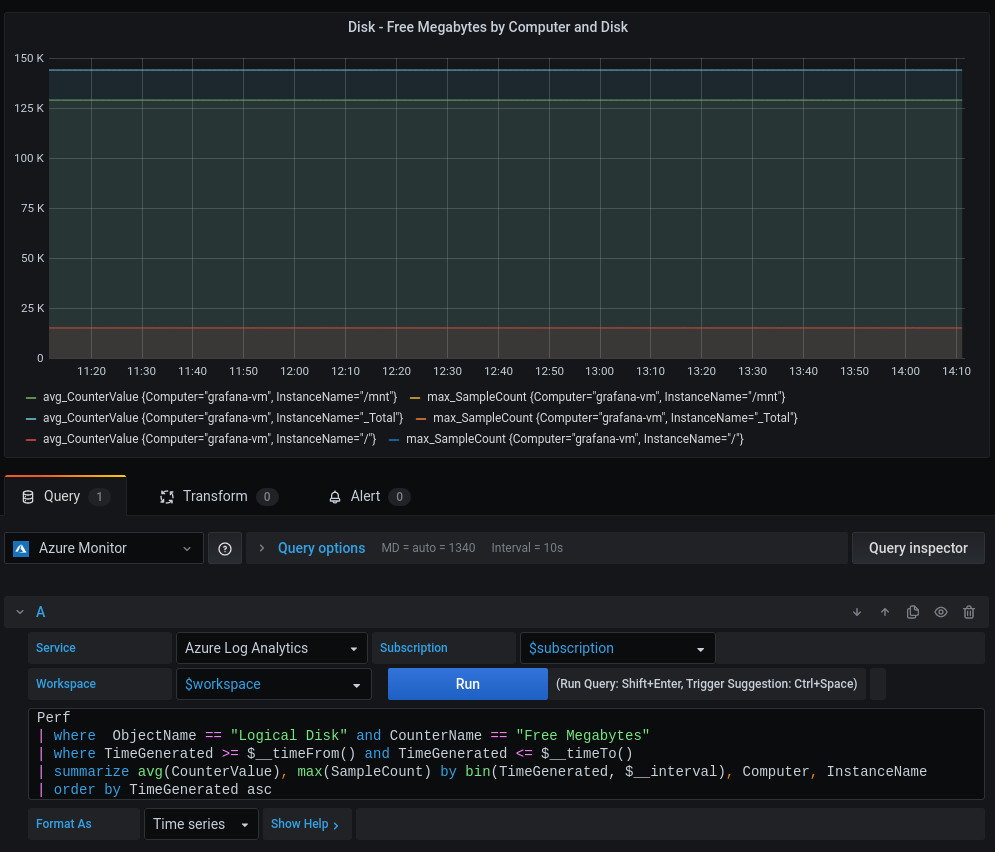
For example, if we update the summarize statement yet again we can include another value column:
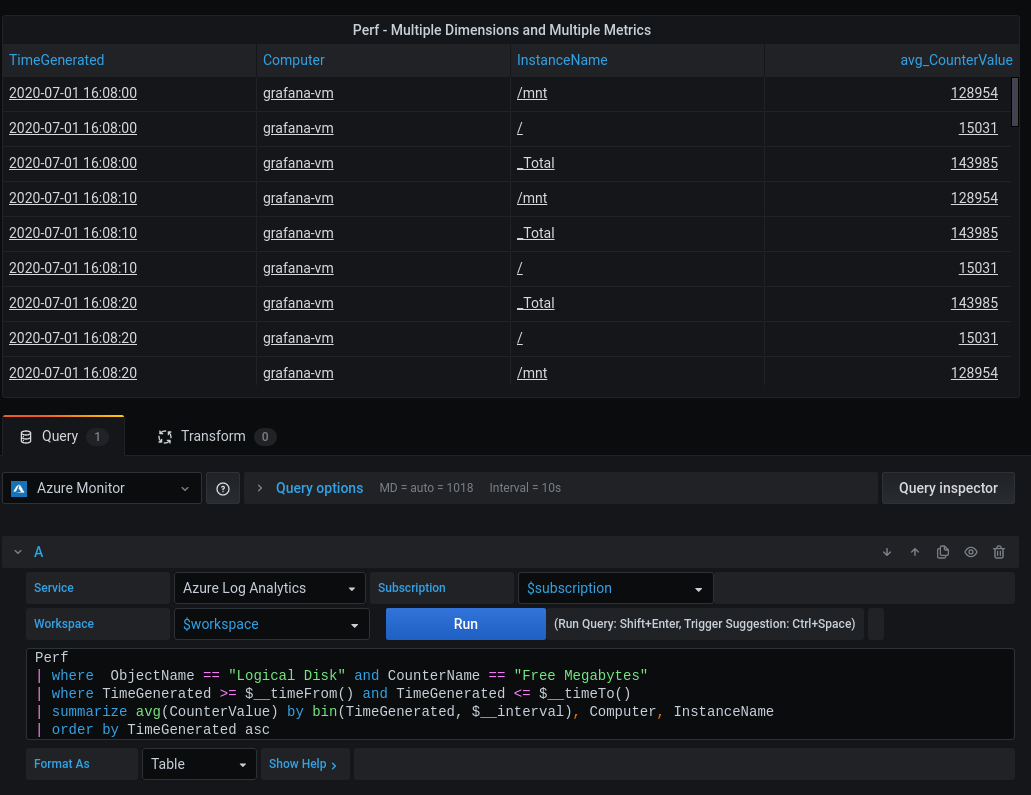
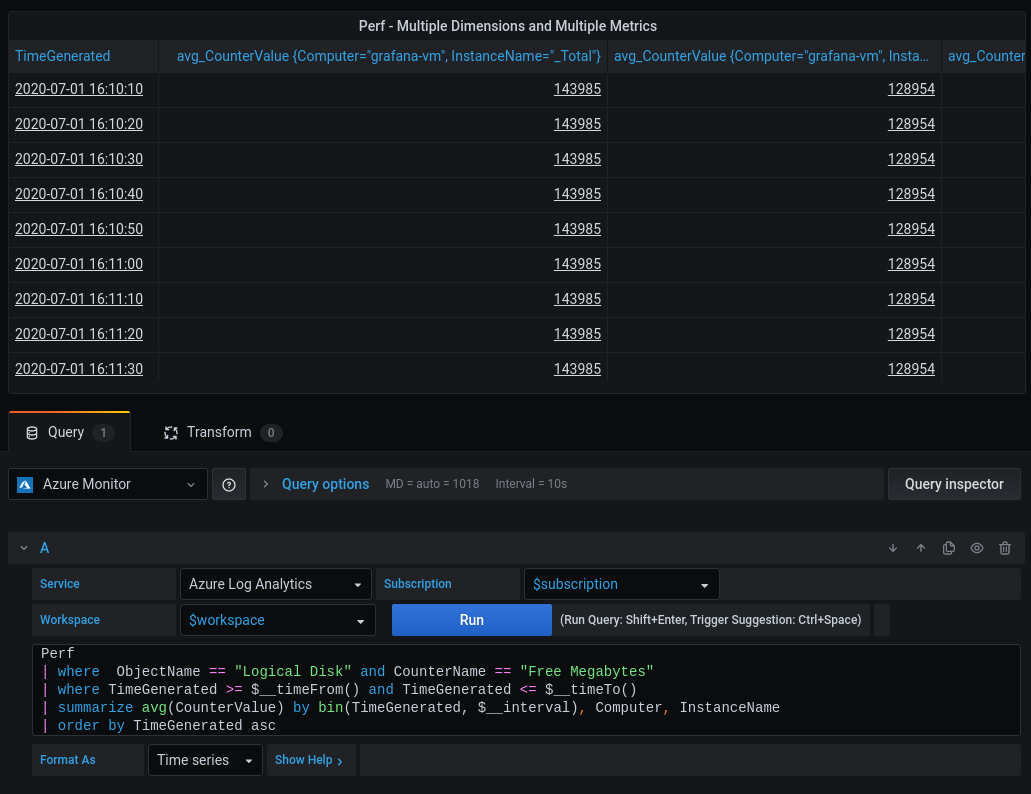
| summarize avg(CounterValue), max(SampleCount) by bin(TimeGenerated, $__interval), Computer, InstanceNameWhen selecting "Format As" in the query editor to "Time series", Grafana does additional data processing to the response from the two Analytics services. This process reformats the data into a time series model Grafana understands. You can bypass this by selecting "Format As" as "Table" to see the table response as returned by the Azure services without this processing.
These services return a table response that consists of columns and rows. For each item selected in your query, the response includes the type of the column. For the purposes of time series formatting, we care about three categories of types:
- Time: Datetime
- Metric: Number (e.g. float, int, etc)
- Dimensions: Other Type (e.g. boolean, string)
For each unique combination of Metric and Dimensions, a time series is created.
Depending on the type of column in the result, it is considered a Time Column, a Metric Column, or a Dimension Column.
Time
The first datetime column found in the response will be the time index for all the series found in the response. The response must be sorted by the time column in ascending order.
(Note: If there are additional time columns, they will be turned in Metric/Number columns that have been converted to epoch, and you probably do not want to do that).
Metric
Any number type columns are considered to be a metrics. The name of the metric will be the name of the number column in the response.
Dimensions
Any other types of columns will become dimensions for the metric. The most common type would be a string column. A dimension ends up as a key=value pair. The key comes from the name of the column, the value will be from the values of that column.
Having dimensions is optional for a query.
Taking the summarize line from our example query that includes a single metric and multiple dimensions:
| summarize avg(CounterValue) by bin(TimeGenerated, $__interval), Computer, InstanceNameSeries will be produced like:
avg_CounterValue {Computer="myHost", InstanceName="/"}
avg_CounterValue {Computer="myOtherHost", InstanceName="c"}
avg_CounterValue {Computer="myOtherHost", InstanceName="d"}
...
Where avg_CounterValue was a Number valued column and came from avg(CounterValue), and the dimensions are {Computer="myHost", InstanceName="/"}. Which comes from selecting the columns Computer and InstanceName. The values, myHost and / come from the rows of their respective columns.
This can also be seen in action by making this query with "Format As" set to "Table" and the table visualization and then comparing it the same query with "Format As" set to "Time series"
By supporting multidimensionality, we are setting the data source up for one of the features we want in the next generation of Grafana alerting, which is too have a single query, and be able to automatically have multiple alerts per specifiable dimensions.
Additionally, the operation that supports extracting series with multiple dimensions from Analytics Services' Table format responses can be reused for SQL. So we will be looking to bring this same multidimensionality with queries to our SQL data sources soon.
