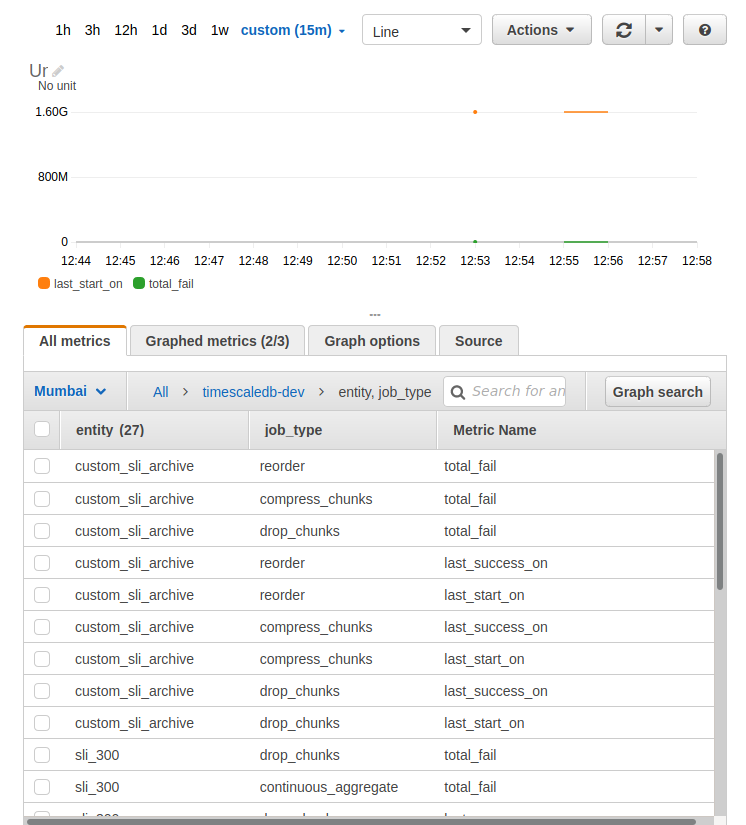
Send TimescaleDB policy stats (and other things) as metrics.
We advise not to pass credentials in configurations, but via Environment or Instance Profiles
env AWS_DEFAULT_REGION="ap-south-1" CLOUDWATCH_NAMESPACE="timescaledb-dev" DATABASE_URL="postgres://dbuser:4c77c8b8-a9e1-c2cd32feaeeb@10.29.152.230:5432/db" ./timescaledb-metrics
While running timescaleDB, there are a lot of background jobs and policies which need constant observation.
Example of such Jobs are:
- drop_chunks policy
- compress_chunks policy
- reorder policy
- continuous_aggregate policy
etc.
Example of the stats that can be pulled from TimescaleDB tables.
| entity_name            | job_type             | last_start_on | last_success_on | total_failures |
|------------------------|----------------------|---------------|-----------------|----------------|
| sli_300                | drop_chunks          | 1600262129    | 1600262129      | 0              |
| custom_sli_archive     | reorder              | 1600195293    | 1600195293      | 6              |
| custom_sli_archive     | compress_chunks      | 1600248496    | 1600248496      | 0              |
| custom_sli_archive     | drop_chunks          | 1600259297    | 1600259297      | 0              |
| sli_archive            | reorder              | 1600195323    | 1600195323      | 10             |
| sli_300                | continuous_aggregate | 1600262169    | 1600262170      | 0              |
| sli_archive            | drop_chunks          | 1600259297    | 1600259297      | 0              |
| sli_archive            | compress_chunks      | 1600257782    | 1600257782      | 8              |
| sli_violations_archive | drop_chunks          | 1600248501    | 1600248501      | 0              |
Keeping a manual eye on these is painful and tedious, and by emitting these as metrics we can be alerted when things go wrong.
While some may argue that the interval of these jobs is not as periodic where they qualify to be a metric system, but as the usage increases these policies end up running closer to every 5 minutes. Alerts on such slopes can catch staleness pretty effectively.
Another problem with the default policy_stats is that the job_id is hardly human readable. It's tough to keep a track of an IntegerID since it changes, on any recreation. But that's a minor win.
Only timescaleDB.
-
As of now we output to Cloudwatch but it can surely be extended to other metric sources. If you want more metric sources, send a Pull Request or just open a new Issue.
-
The reason to not use go-metrics, is the overall lack of precision of timestamps which Cloudwatch is excellent at.
You can export timescale db metrics to Prometheus by setting the path of this file as an environment variable which the postgres-exporter recognizes by default.
export PG_EXPORTER_EXTEND_QUERY_PATH=<path_to_queries.yaml>
Or you can just add this to your existing custom queries.yaml
References: https://github.com/wrouesnel/postgres_exporter#adding-new-metrics-via-a-config-file
This project is sponsored and maintained by Last9. Last9 builds reliability tools for SRE and DevOps.

