Algorithmic Trading in R
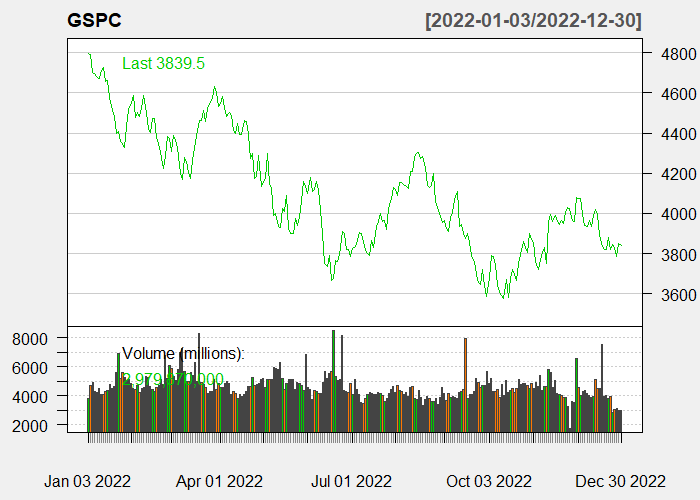
Line chart of daily GSPC Close Price changes in 2022
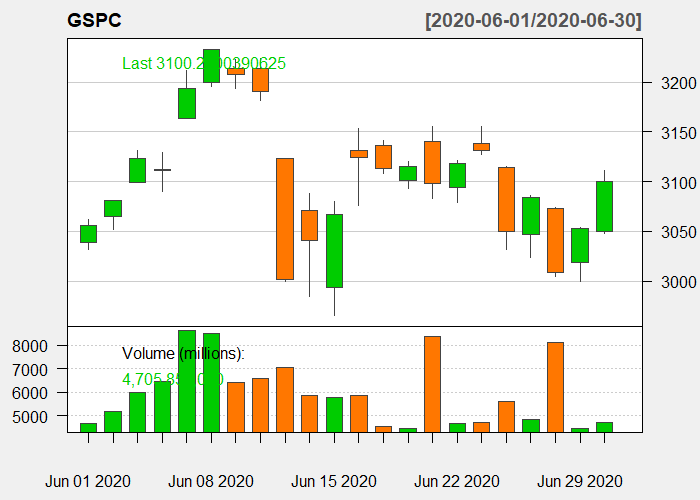
Candlestick chart of daily GSPC Close Price changes in the June of 2020
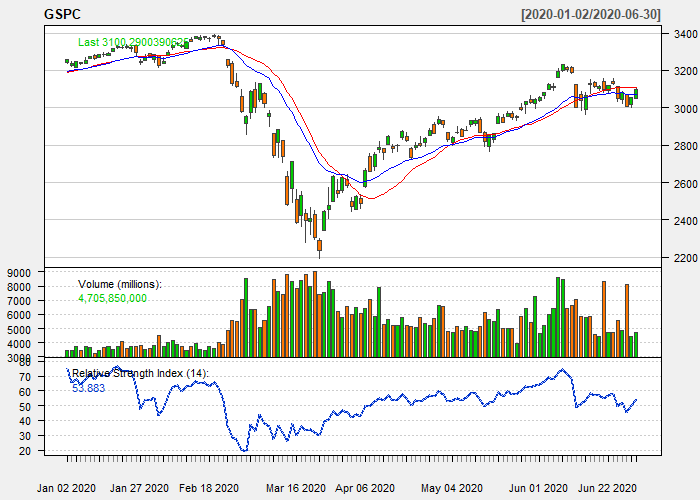
Candlestick chart via RSI-14, EMA-20 and SMA-20 technical indices of daily GSPC Close Price changes in the first 6 months of 2020
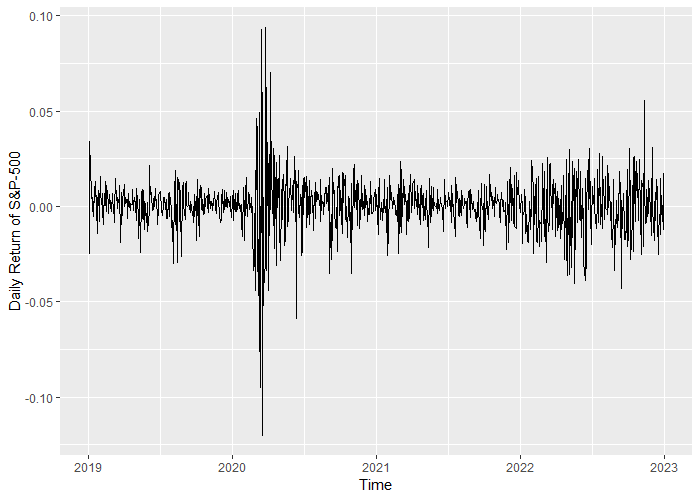
Daily Return changes of S&P-500 during 3 years (from 2019 to 2022)
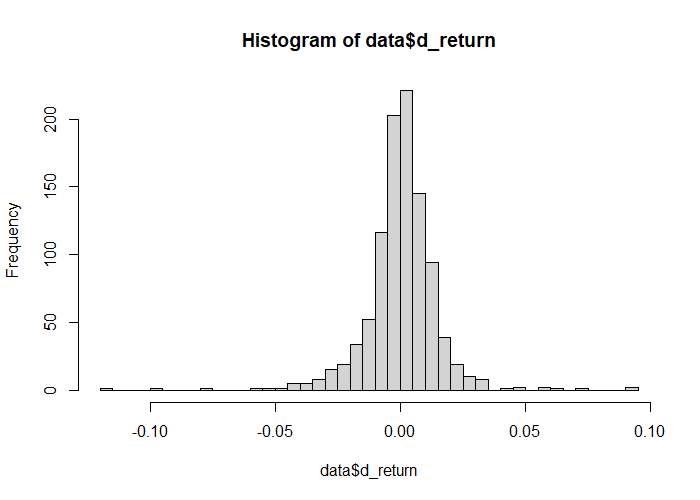
The Histogram of Daily Return of S&P-500 during 3 years(from 2019 to 2022)
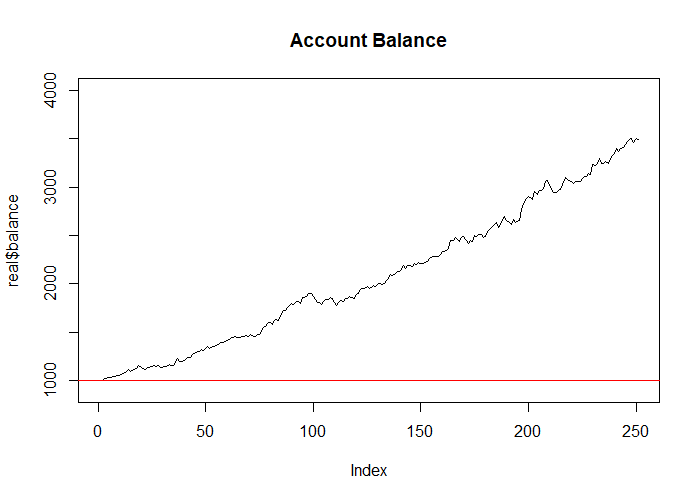
Line chart of virtual account balance changes from 3 January 2022 till 30 December 2022 managed by our AlgoTrading machine
