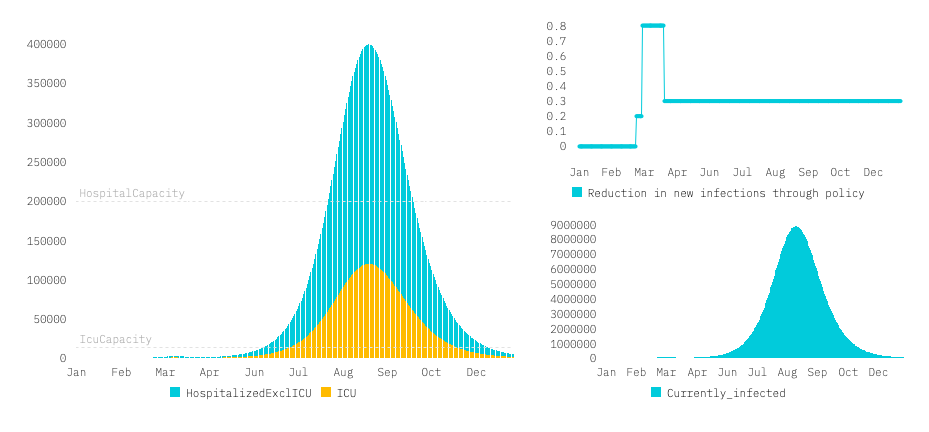
This model is meant to illustrate the dynamic impact of various policy paths. Most existing COVID simulators only allow for a single policy intervention. The set of interventions, however, is important when thinking about exist strategies for the time after the initial peak of infections. For a detailed summary of the model, both verbally and mathematically, please refer to the notebook model summary.
This model is not meant to be used as a forecasting tool. It is very hard to make accurate forecasts for the current epidemic. FiveThirtyEight has a post on why that is. Instead, we aim to illustrate the key mechanics of a simple SEIR model when changing policy dynamically. The model also emphasises the lag structure associated with interventions: With an incubation period, initial period of severely ill individuals at home, and subsequent stays in hospital, policy interventions will only be visible in fatility figures weeks later. For a flow chart of stages in the model, see the summary linked above.
We have tried to stick to standard modelling assumptions and checked our work against existing implementations. Yet, this model is a simple illustrative tool and not even close to a sophisticated, state-of-the-art epidemiological model. Hence, it should not be treated as such.
Another important issue which the dashboard and model hopefully illustrate is that even simple models have many degrees of freedom. Picking the right parameter values is very difficult as many important parameters are currently unknown and subject of ongoing research (e.g. the share of asymptomatic infections, duration of the infectious part of the incubation time). Importantly, model results are very sensitive to parameter choices. We kept most parameters adjustable in the dashboard so you can see the effect of changing assumptions on the outcome.
You can play with the interactive version of the model in your browser underlying code of dashboard.
- COVID Calculator (Code)
- Jim Stock on liftoff and the importance of the asymptomatic rate
- COVID Scenarios by Neherlab
We have followed the code that is underlying the Covid Calculator closesly. We extended the model in a couple of ways. Most importantly, we allow for dynamic policy paths which affect infections caused by all individuals or only by symptomatic individuals. For this, we have added a few additional features. For example, compartments for the asymptomatic part of the incubation period (shared by all individuals) or the share of individuals with an asymptomatic course throughout. Please check the model summary and seir.py for the exact model mechanics.
Friedrich Geiecke
Alsino Skowronnek
Wolfgang Ridinger
Maximilian Eber