Published by Alon Harell(@picagrad), Robyn Ritchie (@ritchi12), and Phil Shreeves (@pshreeves)
Repository containing data and code for our submission to the 2022 Big-Data-Cup at the 2022 Ottawa Hockey Analytics Conference (#OTTHAC22).
See our full submission on https://arxiv.org/pdf/2205.13678.pdf.
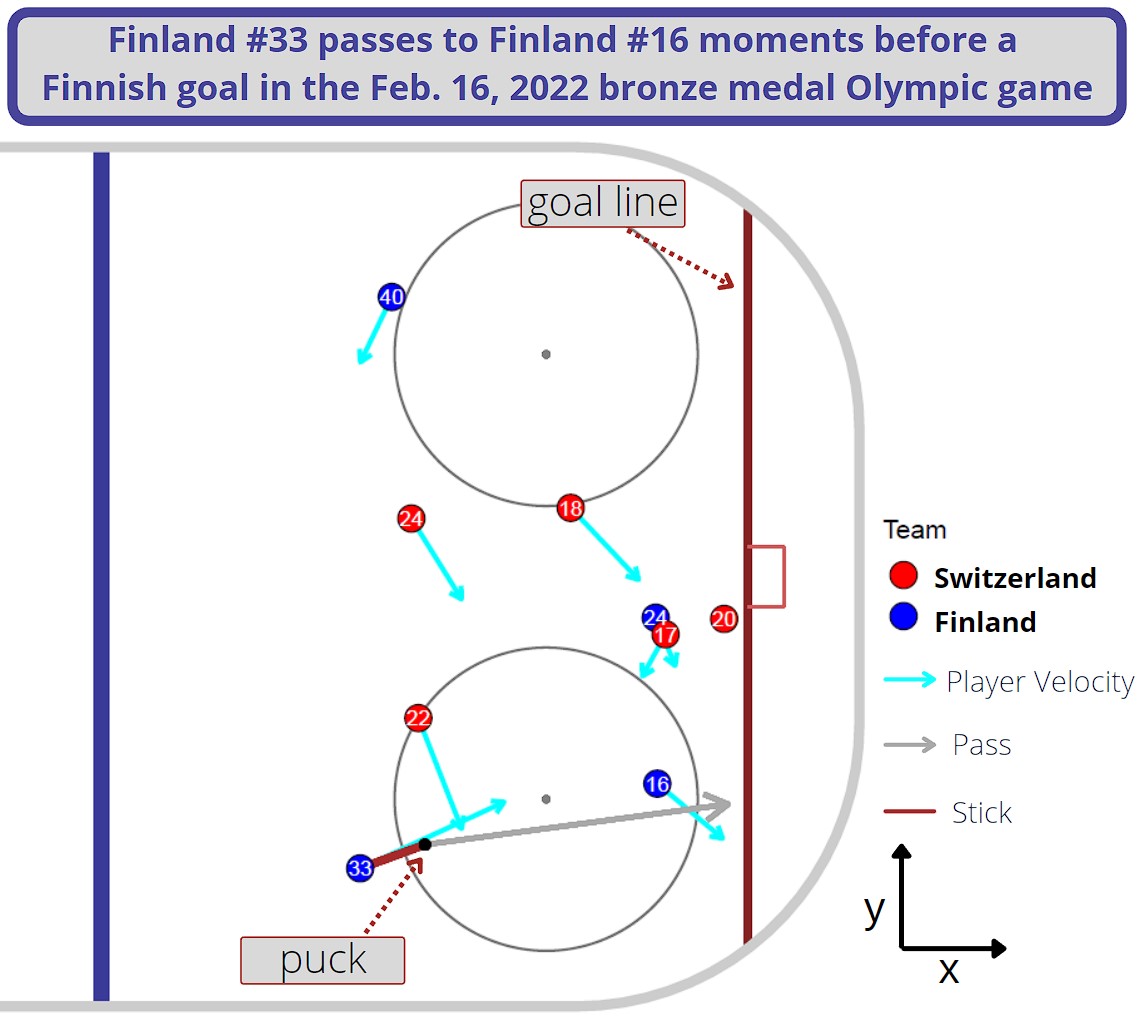
All examples and plots here are taken from the following play:
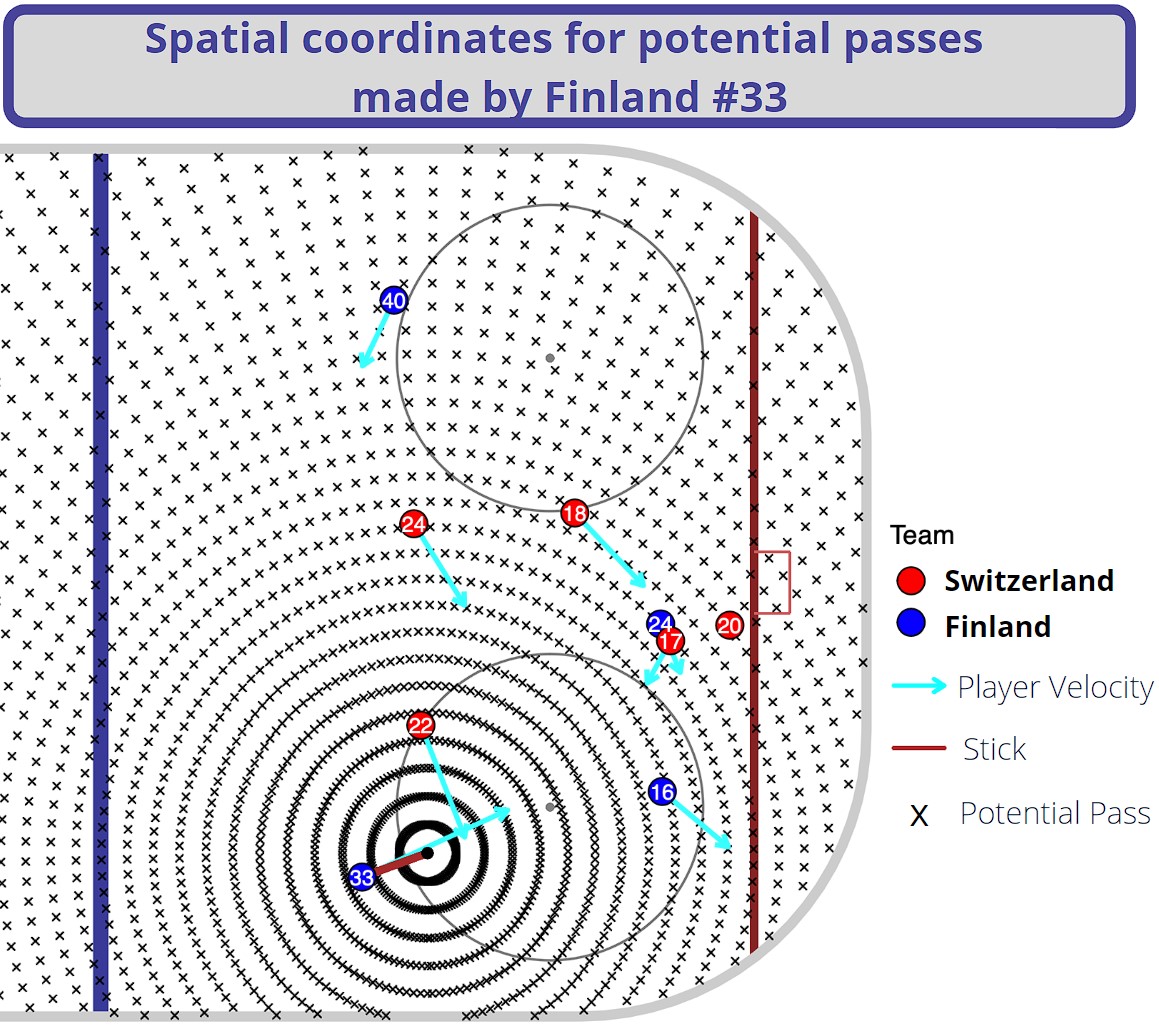
We divide the ice into triplets of time an location based on our puck motion model:
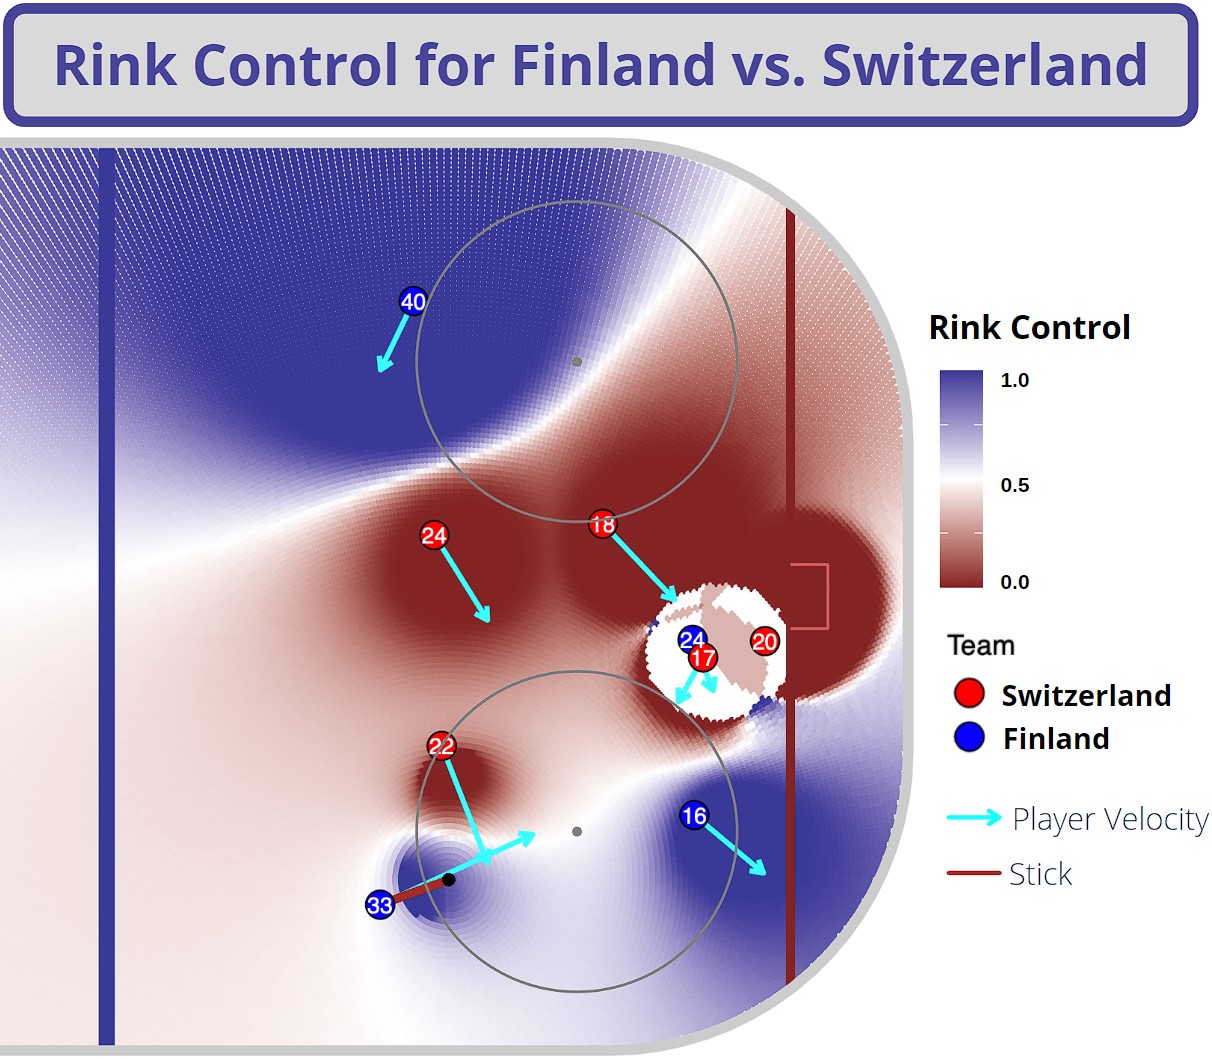
Next, we calculate rink control at all triplets:
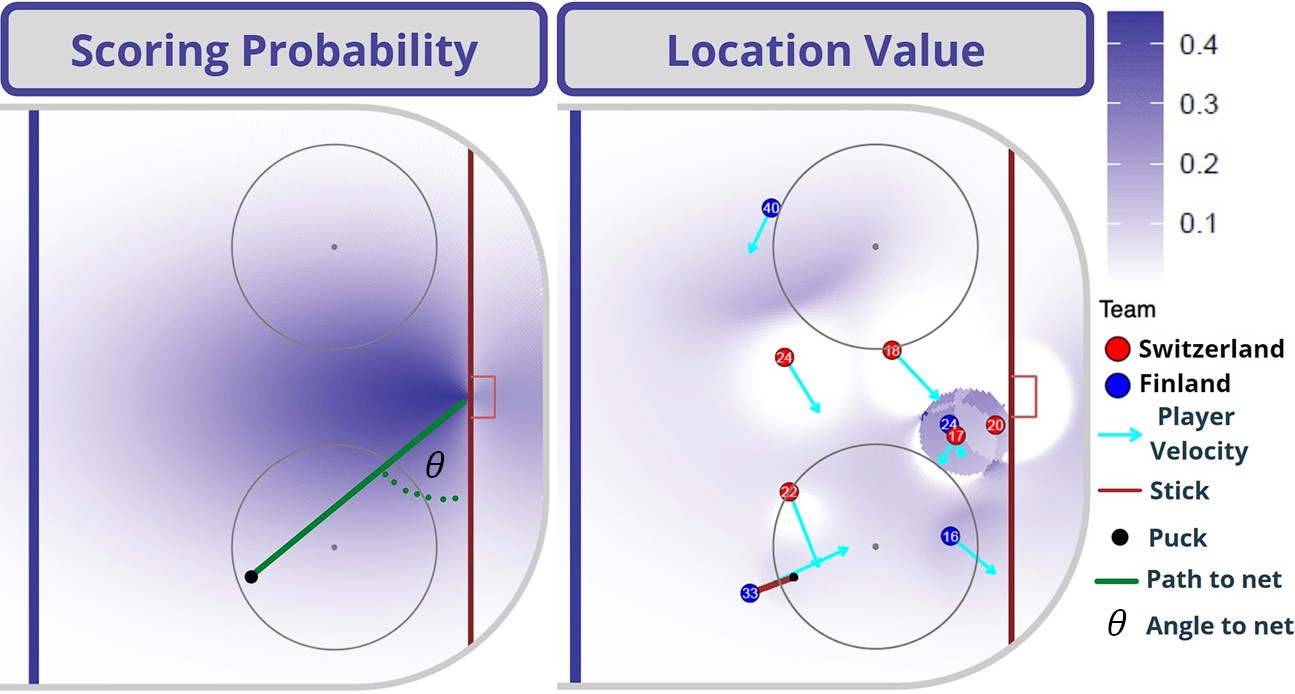
From here we begin using our probabilistic passing model to create some more specific metrics such as:
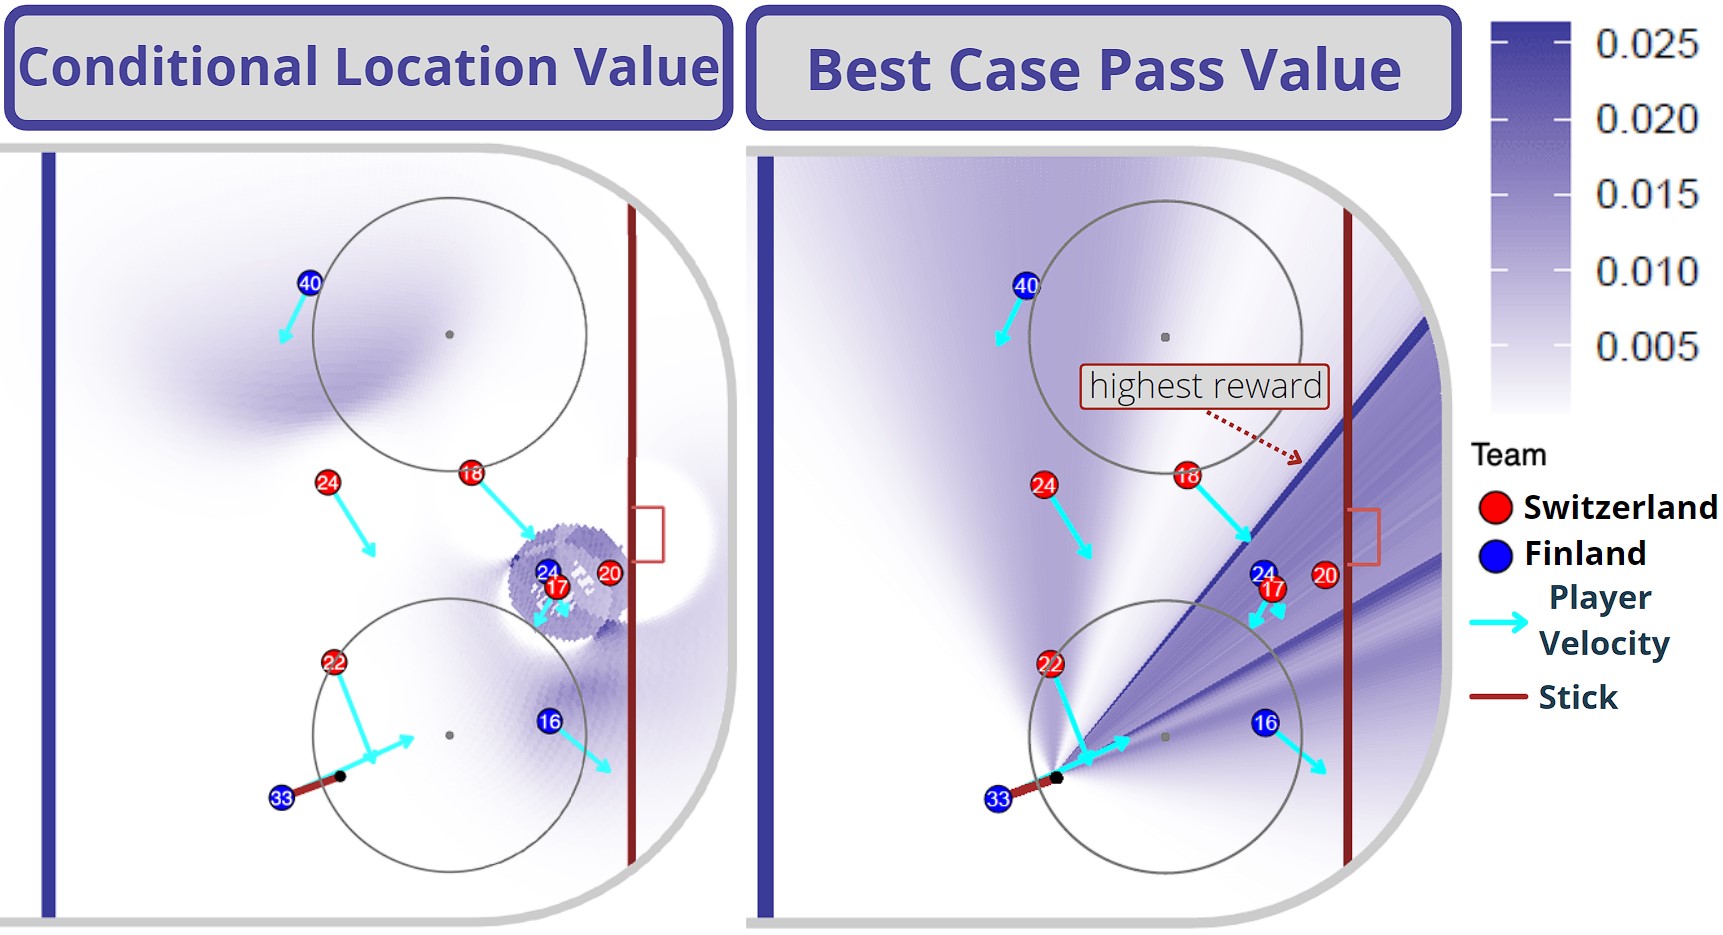
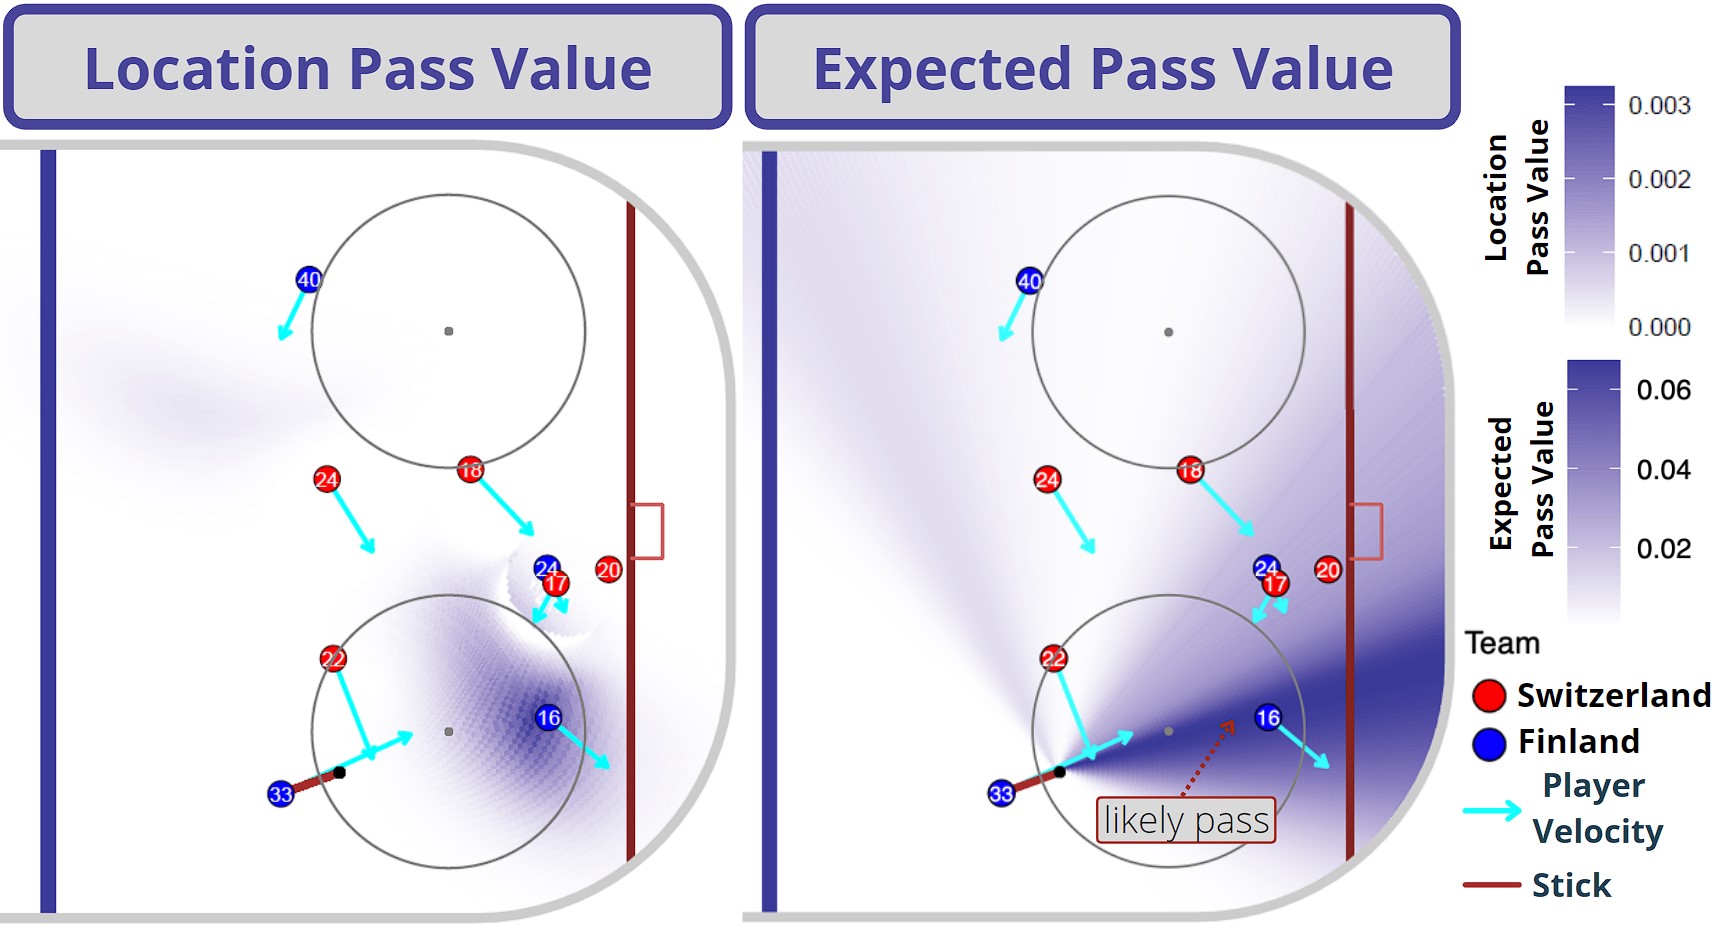
Using these, we go over the entire dataset to produce our summary metrics:
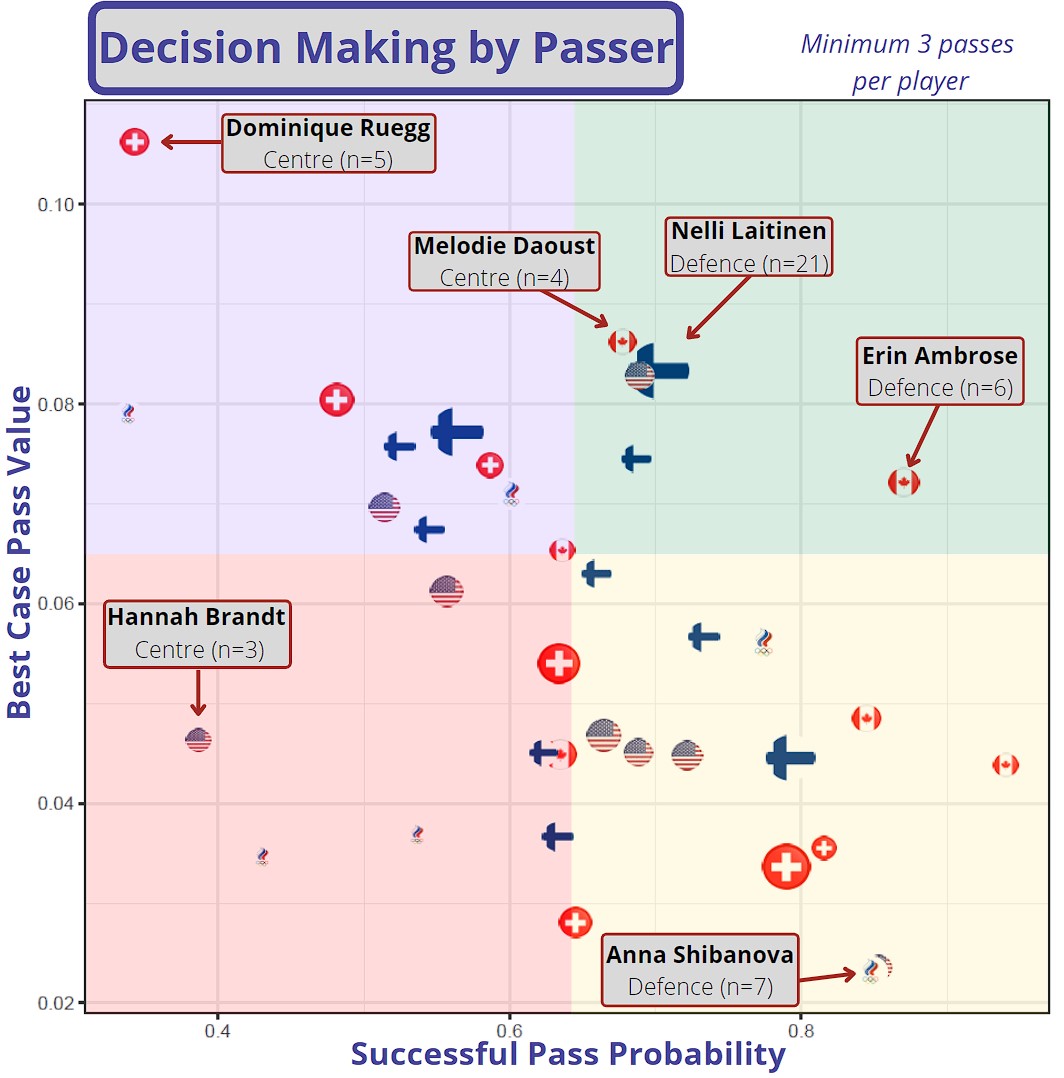
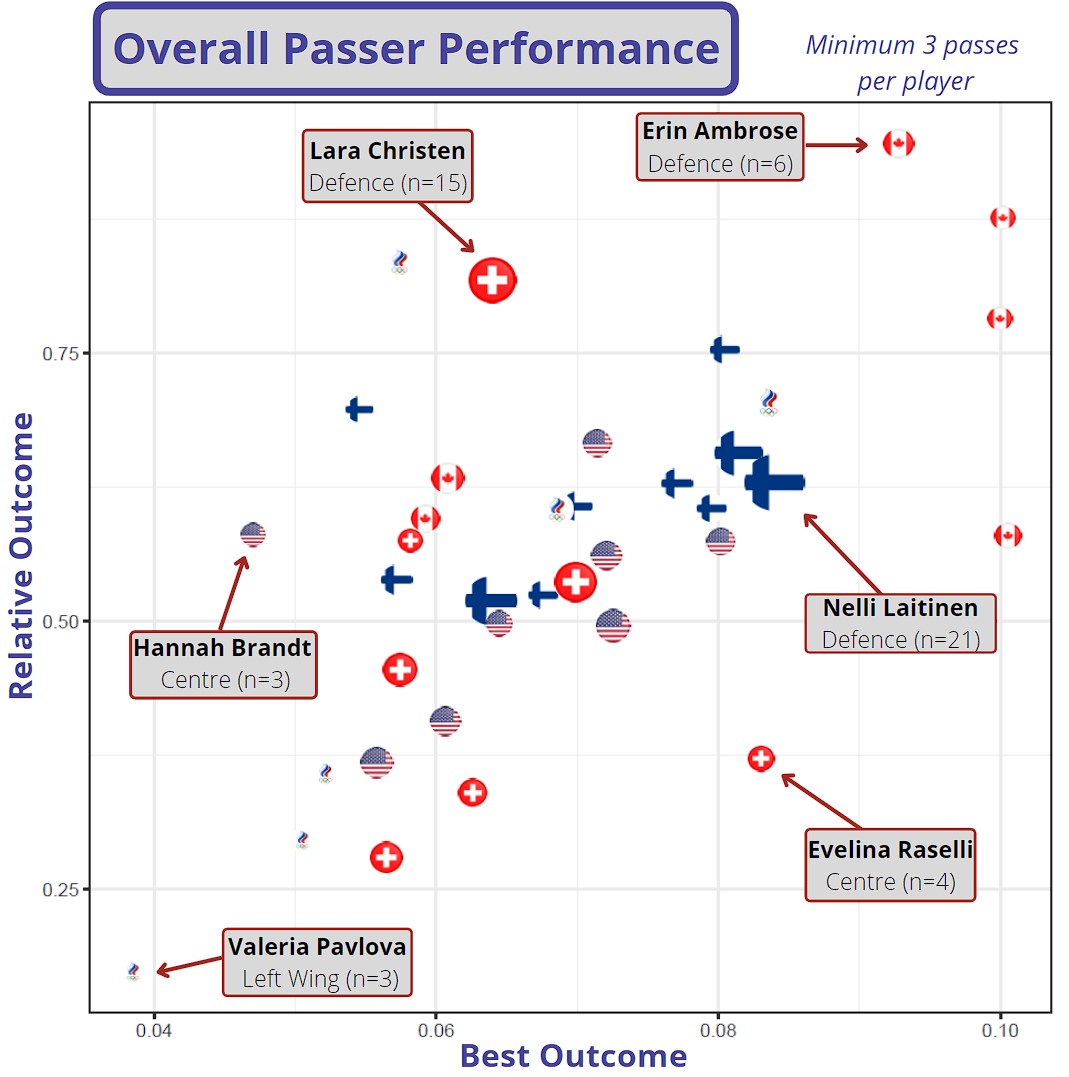
For reading the data we use a jupyter notebook on python. Some basic requirements (older version will likely work just as well):
- Python3 : 3.9.7
- Pandas: 1.4.2
- Numpy: 1.22.3
- IPython: 8.2.0
- ipykernel: 6.12.1
The R code is self contained and will install all necessary packages if run in RStudio version 4.2.0
Data_Clean.ipynb contains all of the data reading and filtering, as well as calculations of speed and angle, and saves a JSON file to be opened by the R code.
BDC_2022_inR.Rmd allows loading, analyzing, and producing the majority of plots for any one specific play.
BDC_PassModel.Rmd contains the code analyzing each play at multiple passing speeds, for the entire dataset.
hockey_pipeline.R contains the majority of our models and auxilliary functions.
interactive_plot.R contains auxilliary code for plotting our summary statistics.