High memory usage in 0.3.40(memory leak?)
CaselIT opened this issue · 66 comments
The fixed implemented in #832 worked for some releases, but I'm having again high memory usage problems (10gb+) with version 0.3.20
These seems to be due to a memory leak: if finishes analyzing the project without problems, using less than 1gb in my case. After working on the project for some time it starts using more memory, even more than 10gb+.
I've not kept note of the details regarding after how long or if there is an action that triggers it. I usually notice a slow down, check the task manager and usually the language service is using many gb of memory. I have not kept track to see it the increase in memory usage is sudden or more gradual.
Below are the packages of the project used and some system information. I haven't checked if I can reproduce this issue in other projects
Is there some logging or telemetry I can enable to help with this issue?
Extension version: 2019.6.22090
Microsoft Python Language Server version 0.3.20.0
Python version: 3.6.8
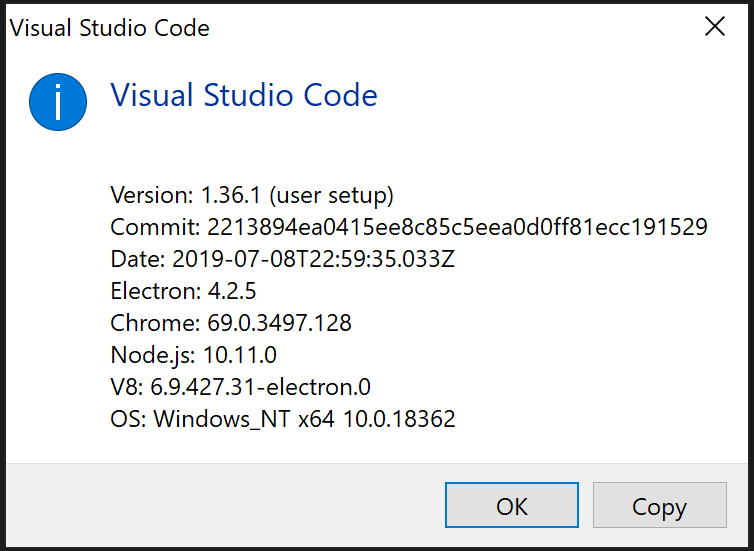
VS Code version: Code 1.36.0 (0f3794b38477eea13fb47fbe15a42798e6129338, 2019-07-03T13:25:46.372Z)
OS version: Windows_NT x64 10.0.18362
requirements of the project
argon2_cffi==18.3.0python-dateutil==2.7.5decorator==4.3.0falcon>=2,<3falcon-auth==1.1.0falcon-cors==1.1.7graphene==2.1.3graphene_sqlalchemy==2.0.0jsonschema==2.6.0keras>=2.1.2numpy>=1.13.3ortools<7.1 pandas>=0.22.0,!=0.24.0psycopg2-binary>=2.7.3.2psycopg2<2.8pyjwt>=1.6.4scikit-learn>=0.19.1scipy>=1.0.0SQLAlchemy<1.3.0SQLAlchemy-Utils>=0.32.21sqlalchemy-postgres-copy>=0.5.0simplejson>=3.13.2tensorflow==1.12.0pyDOE>=0.3.8geomdl>=4.1.0pyomo==5.5.0pyutilib>=5.6.3joblib==0.11pytest>=4.4.0pytest-cov>=2.6.1yapf>=0.20.0,!=0.27flake8>=3.7.0matplotlib>=2.2.3waitress==1.1.0pydot==1.2.4
System Info

| Item | Value |
|---|---|
| CPUs | Intel(R) Core(TM) i7-8650U CPU @ 1.90GHz (8 x 2112) |
| GPU Status | 2d_canvas: enabled flash_3d: enabled flash_stage3d: enabled flash_stage3d_baseline: enabled gpu_compositing: enabled multiple_raster_threads: enabled_on native_gpu_memory_buffers: disabled_software oop_rasterization: disabled_off protected_video_decode: enabled rasterization: enabled skia_deferred_display_list: disabled_off skia_renderer: disabled_off surface_synchronization: enabled_on video_decode: enabled viz_display_compositor: disabled_off webgl: enabled webgl2: enabled |
| Load (avg) | undefined |
| Memory (System) | 23.84GB (10.36GB free) |
| Process Argv | --folder-uri file:///c%3A/Users/path/to/folder |
| Screen Reader | no |
| VM | 0% |
After working on the project for some time
How much time have you used it?
Sorry I should have clarified.
I usually notice the issue after 1-4h of the last reload of vscode or kill of the language service.
But I'm estimating here, I have not traked it precisely
I've checked and I still had vscode open after today. Attached is the log from the python output.
vscode python log.txt
I've killed it at 12, 15:30, then later this evening when I resumed the pc from sleep
Ok, thank you!
We just built 0.3.22, which is available in the beta/daily channels. It contains some fixes which we believe will help solve some of the leaks. You can set this and reload to update:
"python.analysis.downloadChannel": "beta"
I'll try it and report back. Thanks for the quick feedback 👍
I still have the same problem with the 0.3.22.
This is after about 1h of work.

Reinstalling the extension or deleting the folder of the language server may help?
I've logged the memory usage with the performance monitor and this is the graph (in MB)

@CaselIT , If you have a venv, can you create requirements.txt and attach it to the bug?
Attached is a pip freeze of the current environment.
I use conda to manage the environments, but I've used pip to install the packages, so all should be there
pip freeze.txt
I'm noticing the same memory issue. I'll leave VS Code running for about 1hr and it will end up using 10gb of RAM.
OS Version: Version Windows 10.0.18362.175
Python Version: 2.7.16
VS Code version: 1.36.1
Please try the daily build, which has a few more fixes (mainly #1316).
"python.analysis.downloadChannel": "daily"
Currently 0.3.28.
Hi,
Did not see rising memory usage after adding the following line. I kept vscode running for more than 3 hours.
"python.analysis.downloadChannel": "daily"
Closing then.
@MikhailArkhipov I'm still having problems on version 0.3.30.
I'm using the setting "python.analysis.downloadChannel": "daily"
Attached an usage graph collected from the performance monitor. I've also added the cpu usage (in blue) to the graph, since it seems correlated with the memory increase
Note that from about 12 -> 14:30 I was now working in vscode, but had it still open.

I can share the raw data from the performance monitor if it may be useful.
I've tried also with today's dayly, version 0.3.36

@MikhailArkhipov can you reopen the issue? Thanks
Is there some documentation on how I can profile the memory used by the language server?
Sadly, I cannot share the project I'm working on, but I would like to help solve this if I can
There are tools in Visual Studio (Analyze menu) as well as in Debug | Windows | Show Diagnostic Tools
 . https://memprofiler.com/ is very good, I guess you can try trial version.
Actually we don't necessary need your project. Issue may be in some large library you may be importing so list of common imported and installed packages and type of environment (regular, virtual, Anaconda). No need to publish private pieces.
Thanks for the advice, I'll try to profile the memory tomorrow.
I've shared the all the packages I have in the environment in this comment #1298 (comment) above. I don't think my project can be considered large, since it's less than 20k loc
Attached is a profiler session file that can be opened with https://memprofiler.com/
ms.python.ls.prfsession.zip
I've obtained it using NmpCore.exe /da <process id> from https://memprofiler.com/nmpcore
I don't know how to properly use the tool, but it seems most of the memory falls in the category unused overhead

I hope iy helps solving this
I am having similar memory issues, but only when I add a path in my settings python.autoComplete.extraPaths. Removing values there and I no longer get high meomry consuption. Mind you, this is required for adequate intellisense for my current application.

I'm not using python.autoComplete.extraPaths
@CaselIT, do you have any big files in your repo? 50kb or larger?
@jppellerin - since cases may be different, please open separate issue and provide extra path settings. List of imported packages would help too. Thanks.
@CaselIT, do you have any big files in your repo? 50kb or larger?
I do have some, 3 above 50k, ~57K ~72k and ~77k. They are all less than 2k loc
Edit: some other stats: number python files 387, max size 77171B, avg size 5453B
Also confirmed for running in Linux.
In status bar of VSCode, the LS message Analyzing in backgroung, XXXX items left... do not end and the items count restarts very often.
Only one more small comment about the memory leaking behavior. It seems to happen right after I reinstall the package I'm working with pip. After reinstall, the LS seems to re-analyze everything, but not freeing the old analysis.
That's an interesting lead; I'll look now. I recently fixed our package install detection mechanism (it hadn't been working at all), so maybe that's it and some reference to the removed analysis is the issue.
I have not noticed this. I have not changed the installed packaged recently. The environment that I use is not the default one though. The python exe path is set in the workspace setting. May it be correlated?
As far as I can tell, we don't actually drop things from memory on uninstall like we should, so that's something to look into (but could be worked around by restarting the editor), but that likely is not going to be the root cause of the other issues where a project is just opened and uses too much memory.
For consistency, @juliotux make sure you're on the latest build 0.3.38 (which you probably are).
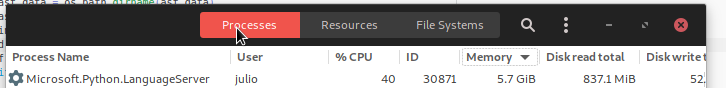
I haven't yet been able to reproduce the memory usage issue with my typical large projects. And to be clear, "large projects" doesn't really have anything to do with the size of the user code; these sorts of memory issues almost always come from a very large set of dependencies. I can have a one-line piece of code like import pandas and that use a lot of memory (because there's a lot in that graph).
I currently have no complaint about the loaded memory usage, it's about 350mb for the project in question, as shown in the profiling screenshot above. The problem is that over time it grows to 10+ gb.
I'm not 100% certain, but I've noticed that the memory does not increase on its own, ie if you leave vscode open but do not interact with it, because you are doing something else, the memory will not increase. Again, it's just something I've notices, but I have not done rigorous testing on it
For consistency, @juliotux make sure you're on the latest build 0.3.38 (which you probably are).
Yes @jakebailey
[Info - 3:09:39 PM] Microsoft Python Language Server version 0.3.38.0
I've tried also with today's dayly, version 0.3.36
@CaselIT when you generated these gaphs, did you make something specific during these peaks of processor usage? Analyzing your graphs and the behavior of my LS, it looks like the memory leak only occurs when, by some reason, the LS restarts the analyzis of the project and the entire list of dependencies.
Nothing particular that I remember, just usual coding. I have notices that changing git branch will restart the language server, but I don't think to have changed branch or done something else git related during that recording.
I usually use another git worktree if I need to check something on a different branch
I can do another recording taking care not to do any git related action and change of packages, environment, etc
Changing git branches is definitely going to lead to bad results (though theoretically not memory issues); the editor doesn't send us change events for unopened files and we wouldn't have any idea that a piece of user code was changed under the hood. AFAIK the common thing with language servers is to tell people to do reloads if that occurs, but I might be mistaken.
@CaselIT I'm looking at the profile you captured and am seeing the same thing. Almost all of the memory is listed as "unused" heap, which I believe is memory that the .NET runtime has retained for future used but has not yet released to the operating system.
Does the machine you captured that profile on have a large amount of memory?
If it's really just large heap free space not being released, I'm not sure what all we can do; As far as I can tell the runtime uses a bunch of rules for deciding if it should release that memory back, including something like "if the machine has a lot of RAM free, don't release any back". We already do heap compaction after large analysis sessions, but small ones would never cause a compact and could also increase memory usage due to fragmentation.
Does the machine you captured that profile on have a large amount of memory?
Not really, it has 24gb of ram. it usually has 90%+ of ram used when the language server is using 10gb of ram. I have the swap space that is system managed on a 1tb ssd that is about 1/4 full, so it may increase quite a bit, but I don't think it would count toward the ram size
@CaselIT, can I ask you to attach WinDBG to your process to verify if we have a case of LOH memory fragmentation? Here is an article on how to do it: https://vimvq1987.com/exploring-large-object-heap-windbg/
I've been experiencing this as well starting a few days ago
@AlexanderSher I've installed windbg and read the article.
Other than !eeheap -gc, is there some other command I can run to aid in solving this?
@CaselIT, can you share the output from !dumpheap [Starting address of LOH]?
I've only got the dump from today that was about 1.1gb. (I've worked mainly on other projects in the last few days).
This is the output of !dumpheap -stat [Starting address of LOH] dupheap stas.txt
The one without stat is still logging
The one without stat is still logging
I've stopped it after more than 1h. The log file is 500+mb
Let me know if the full output is needed.
I'll try to rerun the commands on a dump when the language service uses more memory
This issue is getting pretty serious. In my case opening a project for ~ an hour is enough to bring the system to it's knees. A couple hours and all the memory including swap gets used and the machine starts to lock up.
This particular project has just 635 files but the analyzing message in the status bar is almost always running and never really completes. Many times it has 3-4 thousand files to analyze which means it must be going well beyond the projects's folder. Also they appear to be constantly re-scanned even when no files are being edited or changed.
Note: setting debug configuration "justMyCode" :true reduces the problem substantially, however that also prevents debugging installed modules even those that are a part of the project's build.
Here is an updated output with a dump of 5.2gb.
It has two large object heap so there are two !dumpheap outputs.
dupheap stas.5.2gb.txt
Let me know if there is something else that can help solving this
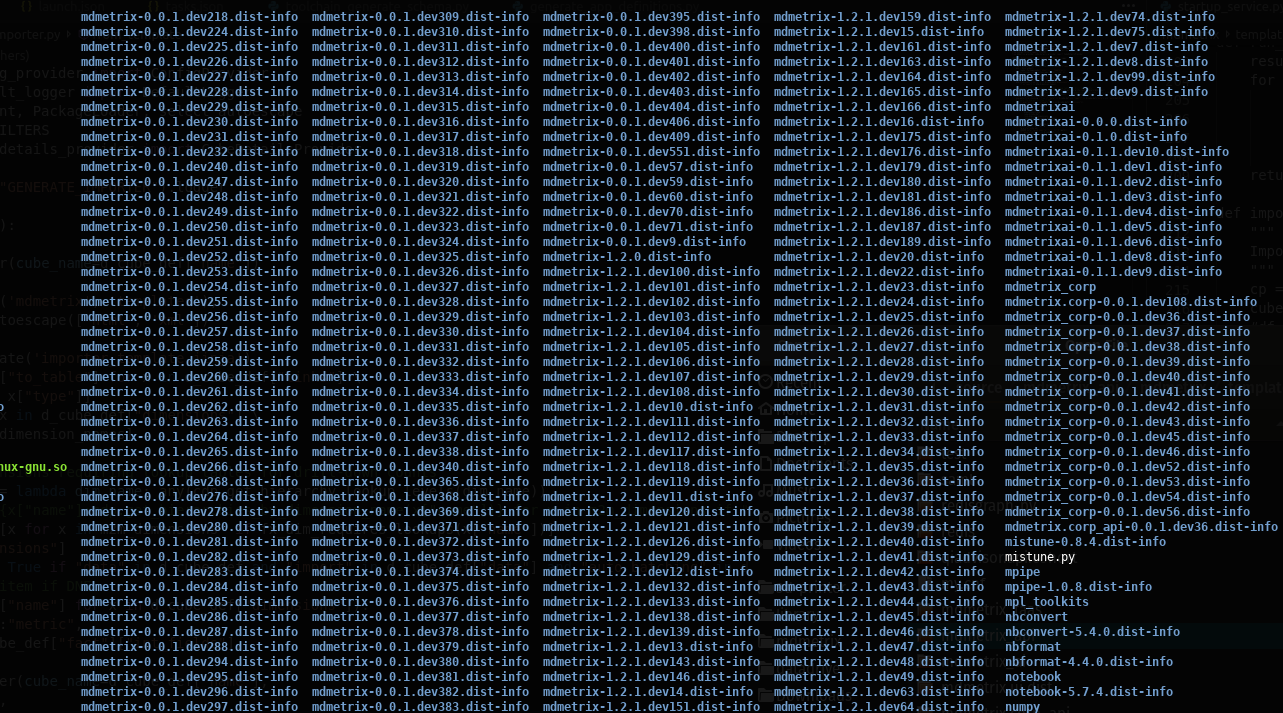
Realizing that justMyCode:true fixes the problem led me to look closely at my installed packages. Then I found that my .../python3.6/site-packages folder had > 200 versions of my project's package library installed. In dev, each time I build a new version, my build script installs that version on the local system. This, over time has led to hundreds of installed versions since they are never automatically uninstalled. So I pip3 uninstall[ed] them until they were all gone and then installed just one copy of the latest version. Now I can run debugging with justMyCode:false and I'm not seeing high cpu or memory usage of the language server any longer. I'm not sure this the only way to reproduce the problem, but maybe it will help someone else to know about this.
@schwab i'm not installing the package I'm developing, so I don't think it will have an impact, but I'll try setting "justMyCode" :true
I've just thought of something, not sure if it may be related.
I use imports only for the typing in an if False: block since it would cause a circular reference if imported normally. Example:
if False:
    # import the type but avoid circular references
    from .somefile import SomeType
...
def someFunction(foo: 'SomeType'):
    ....
The typing is correctly picked up by vscode, so I think the language server support this, but maybe the circular reference causes some problems?
@CaselIT , @schwab - thank you guys very much for helping us with this issue.
This is the output of
!dumpheap -stat [Starting address of LOH]
It looks like you've mistyped the address. It should've been !dumpheap -stat 0x000001da10001000, not !dumpheap -stat 000001da10001000. This probably explains why it took so long to run !dumpheap [Starting address of LOH].
On the other hand, your logs show that version of LS that is installed on your machine has another type of leak: there are 2 millions variables for just 500 modules.
@AlexanderSher I've tried using 0x... and the result of -stat is the same. I'm using the windbg preview from the store
version of LS that is installed on your machine
Current version is Microsoft Python Language Server version 0.3.40.0. This is for sure the version of the second log, the one with 5.2gb. I did not check the version I had yesterday for the other log, the one with 1.1gb, but I think it's the same version.
there are 2 millions variables for just 500 modules.
In the second log there are 11.5m variables in one heap and 2.8m in the second
@schwab For what it's worth, justMyCode is a debugger option; the language server never reads it or uses it in any way.
We just built 0.3.46 to the beta/daily channels with a fix for when modules get reloaded (among other potential fixes), if you'd like to retry. (@juliotux since you had pointed out the pip issues.)
#1407 may also be a source of some leaks, but I'd think only a small contribution.
I think it makes sense to persist some of the analyzing work into some static file
for example, the built in modules, along with some commonly used modules
It does, ongoing work in #472. But leak is a leak and before static storage is created regular analysis needs to run.
wow...... that's a faaast reply.... great thing to know, thanks!
Thanks for the updates
We just built 0.3.46 to the beta/daily channels
I'm on holiday at the moment, when I get back I'll try it and report back
On 0.3.46 the leaking behavior seems to be solved. Now, the LS reaches around 1GB while analyzing the files, and after it, it drops to around 400 MB. Multiple pip install of the project do not accumulate memory as before, getting exactly the same memory behavior every install cycle.
Sorry for the long absence, but I've been on holiday and then had to work on another project for a bit.
This week I've returned to work to the project that has been causing problems, and I still have large memory issues.
This is a dump from Microsoft Python Language Server version 0.3.72.0 with a size of ~6gb
dupheap stas.5.9gb.txt
I'm not been tracking its memory usage but I've noticed that sometimes its memory usage decreases: a few minutes before dumping the memory to collect the stats the language server was using ~8gb, so some progress there seems to have happened.
Hope it helps. I can track its memory usage it may help
Just a follow up.
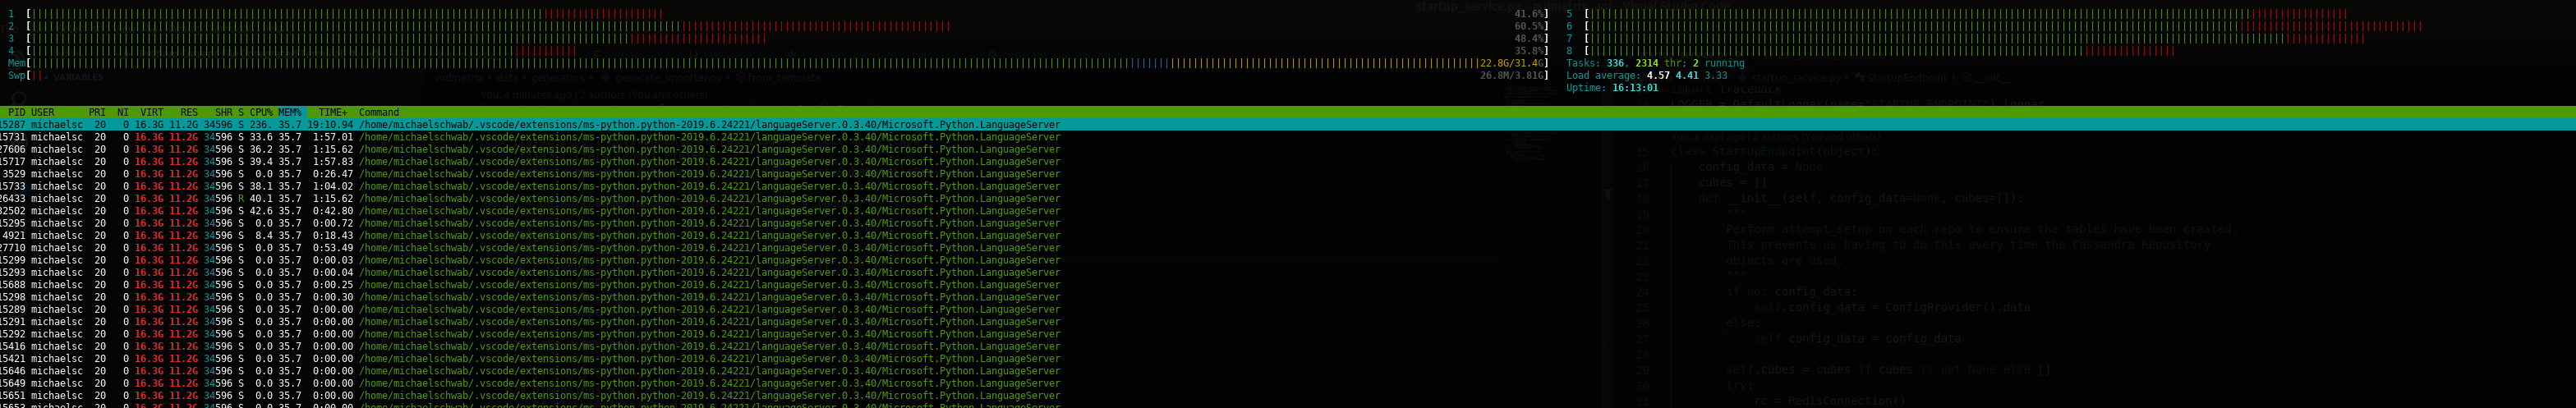
I'm currently working on the sqlalchemy library so I have it installed in editable mode with pip (pip install -e . in the sqlalchemy folder) and after about 1h of working on it, mainly navigating between classes, the language server is at about 4.3 GB or used ram. I'm on Version 0.4.71.0
I was using sqlalchemy also on my original project. I still cannot trigger it on demand, but at least this is now happening on an open source project, so it may be easier to reproduce
I'm using a env only for this, so the packages installed are not that many (sadly I had jupyterlab installed in the same env, so this increases the number of packages, but I'm not using it or referencing it in the project):
Packages
Package            Version      Location
------------------ ------------ -------------------------------------------------
apipkg             1.5
appdirs            1.4.3
asn1crypto         1.2.0
atomicwrites       1.3.0
attrs              19.2.0
backcall           0.1.0
black              19.3b0
bleach             3.1.0
certifi            2019.9.11
cffi               1.13.0
Click              7.0
colorama           0.4.1
cryptography       2.7
decorator          4.4.0
defusedxml         0.6.0
entrypoints        0.3
execnet            1.7.1
importlib-metadata 0.23
ipykernel          5.1.2
ipython            7.8.0
ipython-genutils   0.2.0
jedi               0.15.1
Jinja2             2.10.3
json5              0.8.5
jsonschema         3.0.2
jupyter-client     5.3.3
jupyter-core       4.5.0
jupyterlab         1.1.4
jupyterlab-server  1.0.6
MarkupSafe         1.1.1
mistune            0.8.4
mock               3.0.5
more-itertools     7.2.0
nbconvert          5.6.0
nbformat           4.4.0
notebook           6.0.1
packaging          19.2
pandocfilters      1.4.2
parso              0.5.1
pickleshare        0.7.5
pip                19.2.3
pluggy             0.13.0
prometheus-client  0.7.1
prompt-toolkit     2.0.10
psycopg2           2.8.3
py                 1.8.0
pycparser          2.19
Pygments           2.4.2
PyMySQL            0.9.3
pyparsing          2.4.2
pyrsistent         0.15.4
pytest             5.2.1
pytest-forked      1.0.2
pytest-xdist       1.30.0
python-dateutil    2.8.0
pywin32            225
pywinpty           0.5.5
pyzmq              18.1.0
Send2Trash         1.5.0
setuptools         41.4.0
six                1.12.0
SQLAlchemy         1.4.0b1.dev0 c:\\sqlalchemy\lib
terminado          0.8.2
testpath           0.4.2
toml               0.10.0
tornado            6.0.3
traitlets          4.3.3
wcwidth            0.1.7
webencodings       0.5.1
wheel              0.33.6
wincertstore       0.2
zipp               0.6.0
I'll try recreating the env with only sqlalchemy and its dependencies to check if the problem persists
Cloning and opening sqlalchemy as a workspace yielded ~500MB RAM consumption. This is 0.5.10
Since about version 0.5 I don't seem to notice overly large memory usage, sometimes I've seen a couple of GB, but I have not had to kill the language server for it. I'm not monitoring it closely though
I'm not sure if the underling issue has been solved or not, but I think this can be closed for now. If I notice again the same high usage I'll reopen this (or a new one)
Thanks! 2GB is high-ish, but with large libraries sometimes happens during peak consumption which should be released when analysis is done.
Thanks for the improvements you and your team have doing to the language server 👍