High memory usage
gramster opened this issue · 99 comments
@suiahaw commented on Tue Mar 26 2019
Issue Type: Bug
Some questions about the python plugin encountered when building python library indexes
I strongly hope that the python plugin does not read the information into memory in real time when creating the python library index, but instead saves the index file in order to speed up the time and reduce memory overhead.
The python library is really too big. Sometimes I have to wait a few minutes for writing a small amount of code.
Extension version: 2019.3.6139
VS Code version: Code 1.32.3 (a3db5be9b5c6ba46bb7555ec5d60178ecc2eaae4, 2019-03-14T23:43:35.476Z)
OS version: Windows_NT x64 10.0.17763
System Info
| Item | Value |
|---|---|
| CPUs | Intel(R) Core(TM) i5-7200U CPU @ 2.50GHz (4 x 2712) |
| GPU Status | 2d_canvas: enabled checker_imaging: disabled_off flash_3d: enabled flash_stage3d: enabled flash_stage3d_baseline: enabled gpu_compositing: enabled multiple_raster_threads: enabled_on native_gpu_memory_buffers: disabled_software rasterization: enabled surface_synchronization: enabled_on video_decode: enabled webgl: enabled webgl2: enabled |
| Memory (System) | 15.86GB (8.60GB free) |
| Process Argv | |
| Screen Reader | no |
| VM | 46% |
@algo99 commented on Wed Mar 27 2019
I can confirm, on Windows 10.
After update (yesterday) of Python Language Server and/or vscode_python extension VSCode not more usable. See the disk I/O and memory consumption:

The extension proceeds after VSCode start:
Analyzing in background, 6879 items left ...
and this process does not stop.
I tried several times to restart VSCode, but it does not help.
@algo99 commented on Wed Mar 27 2019
Just noted in Python output pane:
...
[Info  - 09:17:10] Microsoft Python Language Server version 0.2.31.0
[Info  - 09:17:10] Initializing for c:\3rd\WinPython\python-3.7.2.amd64\python.exe
Traceback (most recent call last):
  File "C:\Users\zkr\.vscode\extensions\ms-python.python-2019.3.6139\languageServer.0.2.31\scrape_module.py", line 1497, in <module>
    state.collect_second_level_members()
  File "C:\Users\zkr\.vscode\extensions\ms-python.python-2019.3.6139\languageServer.0.2.31\scrape_module.py", line 944, in collect_second_level_members
    self._collect_members(mi.value, mi.members, substitutes, mi)
  File "C:\Users\zkr\.vscode\extensions\ms-python.python-2019.3.6139\languageServer.0.2.31\scrape_module.py", line 958, in _collect_members
    raise RuntimeError("failed to import module")
RuntimeError: failed to import module
Traceback (most recent call last):
  File "C:\Users\zkr\.vscode\extensions\ms-python.python-2019.3.6139\languageServer.0.2.31\scrape_module.py", line 1489, in <module>
    state.initial_import(sys.argv[2])
  File "C:\Users\zkr\.vscode\extensions\ms-python.python-2019.3.6139\languageServer.0.2.31\scrape_module.py", line 872, in initial_import
    mod = __import__(self.module_name)
  File "c:\3rd\winpython\python-3.7.2.amd64\lib\site-packages\cvxopt\__init__.py", line 50, in <module>
    import cvxopt.base
ImportError: DLL load failed: Das angegebene Modul wurde nicht gefunden.
@dilzeem commented on Wed Mar 27 2019
I am also getting the same issue as well on Windows 10.
It only happens once I start debugging some code.
It renders VScode unusable.
@suiahaw commented on Wed Mar 27 2019
It only happens when the python plugin loads the python library, which requires a lot of CPU and memory. And these information that is loaded into memory is estimated to be used for IntelliCode.
@ray306 commented on Wed Mar 27 2019
The same problem happens today. I think it's a bug of new Python plugin just released yesterday (March 26).
@dilzeem commented on Wed Mar 27 2019
Possibly a duplicate of of this in the python language server:
@suiahaw commented on Wed Mar 27 2019
Possibly a duplicate of of this in the python language server:
I also think that the issues area of the python plugin has a large part of similar content related to such a bug. It seems that this bug is very disturbing programming and needs to be solved urgently. ;-)
Could you post specific memory consumption and approx time time to when analysis completes. Generally you don't have to wait until it completes as it is a background task that collects information in stages. 4GB consumption may happen, eventually memory is released.
#450 was about 30GB+ or runaway consuming all memory, so it is not a duplicate. Number of tasks is limited so process should not be consuming all CPU, limit is ~40% or so.
If we can clone projects for investigation it would be helpful too.
Thanks.
It was strange enough for me.
-
I work normally with WinPython. As I wrote above the analysis task do not stop (also over night). At the end VSCode just crashed. All the time the GUI was not usable at all.
-
Today I installed Anaconda3, and then tried again, and VSCode works with Python as usual, just these messages in output Python pane still here:
Traceback (most recent call last):
  File "C:\Users\zkr\.vscode\extensions\ms-python.python-2019.3.6139\languageServer.0.2.31\scrape_module.py", line 1489, in <module>
    state.initial_import(sys.argv[2])
  File "C:\Users\zkr\.vscode\extensions\ms-python.python-2019.3.6139\languageServer.0.2.31\scrape_module.py", line 872, in initial_import
    mod = __import__(self.module_name)
  File "c:\3rd\anaconda3\lib\site-packages\scipy\__init__.py", line 62, in <module>
    from numpy import show_config as show_numpy_config
  File "c:\3rd\anaconda3\lib\site-packages\numpy\__init__.py", line 140, in <module>
    from . import _distributor_init
  File "c:\3rd\anaconda3\lib\site-packages\numpy\_distributor_init.py", line 34, in <module>
    from . import _mklinit
ImportError: DLL load failed: Das angegebene Modul wurde nicht gefunden.
Looks like the server can not import some DLL related to numpy now.
When you look at my report above (with WinPython), there was some DLL related to cvxpy.
Could it be some ABI issue ?
Because I noted yesterday, that I updated my Visual Studio Build Tools 2017 and decided reinstall cvxpy package (actually rebuilding related DLLs)
pip install -U cvxpy
And after restarting VSCode (yesterday with WinPython) there was not messages with cvxpy, but many related to another packages like "DLL load failed"
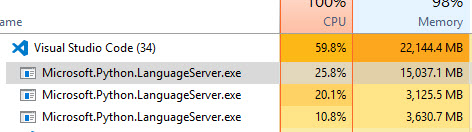
Some further information:
I did have consumption at 22GB+, with CPU usage at around 15-25%.
It happens when I open any python file. This is after 30 seconds after opening a simple python file, which just imports pandas.

It was analyzing a few files indicated at the bottom of the toolbar:

After a few minutes it has stabilized to this:

I believe the issue is when I have virtual environments folder within the workspace, it causes a huge spike in RAM usage by analyzing over 7000+ files.
Version: 1.32.3 (user setup)
Commit: a3db5be9b5c6ba46bb7555ec5d60178ecc2eaae4
Date: 2019-03-14T23:43:35.476Z
Electron: 3.1.6
Chrome: 66.0.3359.181
Node.js: 10.2.0
V8: 6.6.346.32
OS: Windows_NT x64 10.0.17134
After analysis, I think memory consumption
is caused when the python plugin creats the python library index by reading the information into memory in real time. (The memory consumed by the Python library index is for the IntelliSense, I think)
Further, memory consumption and approx time time to when analysis completes depends on the size of the extra library installed for Python. (In other words, the bigger the Python library, the greater the memory occupies, and the more time required)
For anaconda installed by default, memory consumption is about 6GB and approx time time to when analysis completes is about 15 mins.
I can debug existing code before it's done, but I can't use IntelliSense when writing code.
Thanks!
RAM consumption for me hit 7.7GB before running out of memory.
Amount of modules remaining to analyze continuously rises as well
@algo99 The DLL importing thing was technically a problem in the old version, but just wasn't printed. The currently released version does print it, but we merged a PR which when released will re-hide it (see #823).
@suiahaw The language server doesn't keep an on-disk version of the analysis yet (and never has, apart from scraped information from compiled libraries that cannot be directly parsed and analyzed). That is #472.
@dilzeem, import pandas means the LS will analyze pandas and its transitive dependencies (numpy etc), so there is a lot going on at first. Taking a couple of minutes for that is not unexpected, but after that you should have many completions available (and many which we simply did not have at all in the previous language server). Just want to set expectations around expected behavior versus actual bugs. We want to track down bugs like memory leaks and analysis not completing, and we will make improvements in the future around caching and type stubs to speed up analysis of common packages, but its also the case that having some initial cost to analysis is to be expected when importing complex packages.
@algo99 The DLL importing thing was technically a problem in the old version, but just wasn't printed. The currently released version does print it, but we merged a PR which when released will re-hide it (see #823).
@suiahaw The language server doesn't keep an on-disk version of the analysis yet (and never has, apart from scraped information from compiled libraries that cannot be directly parsed and analyzed). That is #472.
If no an on-disk version of the analysis exists, this means that whenever I write a Python program using vscode, I would have to suffer extra memory and time overhead. This will make me unable to use vscode as my main development tool. an on-disk version of the analysis is necessary. On the other hand, the extra disk overhead brought by the analysis can be solved by database compression and periodic reminding users to clean up.
@MikhailArkhipov, @gramster thanks for the quick response.
Okay, it was surprising as I didn't have any issues like this until the March Python Extension update. So it was unexpected behavior.
Okay I will see if I can recreate the 25GB+ scenario tomorrow, and give you an update. The project I was using had a lot of modules, mainly scikit-learn, pandas, dash and gensim.
The computer actually crashes when I opened two similar projects in different windows.
I'm not sure if this is an old bug, since I'm also seeing this behavior only after the most recent update.

I started facing this issue in the last week. My laptop has 8GB RAM and the OS is Ubuntu 16.04. After opening a python file, the RAM usage shoots up until it is completely eaten. The only way I am able to use VSCode is by disabling the extension.
I tried disabling python.jediEnabled and tried removing it from .vscode folder and reinstalling it. However, the issue still persists.
Just an update:
Just importing 4 libraries. Initially got this with analyzing in background at the bottom which is frozen with 9709 items left:

After it has been analyzing for approx 30 mins it is still 20+ GB Ram Usage. Also the number of items left has increased to 10479.

After 40 mins of analyzing VScode crashed.
Just an update:
Just importing 4 libraries
Analyzing in background at the bottom is frozen ad 9709 items left.
It has been analyzing for approx 30 mins and still 20+ GB Ram Usage. Also the number of items left has increased to 10479.
I will keep it running, and will see it if reduces, and at approx how long it took.
After experimenting, I think memory consumption and approx time time to when analysis completes depends on the size of the extra library installed for Python , instead of that how many libraries be imported.
See details: #832 (comment)
I just import Tensorflow 13.1 ... when analysis it cost 10 Gb memory, when finshed it cost 8 Gb memory.
OS: ubuntu 18.04
vscode version:
1.32.3
a3db5be9b5c6ba46bb7555ec5d60178ecc2eaae4
x64

After experimenting, I think
memory consumption and approx time time to when analysis completesdepends on the size of the extra library installed for Python , instead of that how many libraries be imported.See details: #832 (comment)
I am not so sure that is the case.
When I import pandas only, VScode can handle it, after 5 mins it uses 6GB of RAM
When I import 3 or 4 libraries, VScode crashes, and maxes out my RAM (20 GB+)
Same issue here, high memory consumption and it does not seem to end the background analysis.
It is completely unusable since the March update.
The previous version with the same project worked mostly fine regarding memory consumption and resource usage during analysis
Definitely also occurs on Mac (10.14.4).
Here after just a few minutes of leaving Code idly in the background:

Code is already eating up 10 Gb of RAM, and it's still going up.
Let me know if I can provide something more useful than these screens.
@gramster I'm on windows 10
The screenshot from @zhen8838 #832 (comment) seems on ubuntu
I'm running linux (fedora) - and seeing the issue.
@gramster
The following is my personal inference (It is translated by Google Translate from Chinese):
The principle of the Microsoft Python analysis engine is to load all the information of the installed python module into the memory at one time. After the full load, the code intelligent reminder (IntelliCode) is fast, but the memory occupancy rate is very large.
But Jedi works by loading information when a piece of information is needed. This will reduce the long-term memory usage, but the code hints (IntelliCode) will be slightly delayed and the CPU usage will be high when loading.
I hope this will help you.
I'm on Ubuntu and get the same memory usage problem (see #831, a very linked if not duplicate issue).
Hi all
There are three primary things of interest here:
- peak memory usage
- analysis time
- analyses that never stall or never complete
We should push out an update later today which will help address the first issue. It will increase analysis time on systems with ample RAM but if you are on a memory constrained system may make things better by reducing paging. We should be able to make further improvements to memory consumption over the next few days.
Regarding analysis time, yes, longer term we plan to implement caching and keep making improvements (e.g. more extensive use of type stubs). The older language server didn't use caching so this isn't a regression, and we found that with packages like numpy taking typically about 10 seconds to analyze that analysis time was actually much improved. It may be that people are misattributing the time the old language server took; it is much more obvious now as we show the items remaining count.
Regarding the third point, those are clearly bugs that we need to track down and address, so reports of this and any repro steps will be very helpful.
On the other hand, this new language server does have a number of improvements in the completions it can offer, and we wanted to get it out to get feedback. It looks like we may have been too hasty and I apologize for that (the decision was ultimately mine so please direct your anger at me and not at any other members of the team, who have been working very hard on this). For those who cannot be patient while we try to make this right, we suggest switching to jedi, at least in the short term, but I hope that we can make things much better within days.
Thanks.
0.2.34 was published to stable and it should limit memory consumption (more improvements to come in the next few days).
You can either reload the window and the extension should download new LS, or, if it doesn't, use Open Extensions Folder command and delete languageServer* subfolder in the Python extension, then restart VS Code.
@suiahaw - although it is technically possible to delay-load some modules, it only helps partially. Jedi is primarily completion engine while LS also handles multiple other cases such as live syntax check, linting, find references, rename, etc. Therefore is collects information that otherwise handled by rope, ctags, and so on.
Jedi is also known to consume tens of GB on large libraries (see microsoft/vscode-python#263 and microsoft/vscode-python#744 - extension kills Python process if it exceeds certain limit of memory.
Now, the issue is not actually in the analysis. The issue is in imports dependency graph we build and that is going to be fixed in the next few days.
@suiahaw - although it is technically possible to delay-load some modules, it only helps partially. Jedi is primarily completion engine while LS also handles multiple other cases such as live syntax check, linting, find references, rename, etc. Therefore is collects information that otherwise handled by rope, ctags, and so on.
Jedi is also known to consume tens of GB on large libraries (see Microsoft/vscode-python#263 and Microsoft/vscode-python#744 - extension kills Python process if it exceeds certain limit of memory.
Now, the issue is not actually in the analysis. The issue is in imports dependency graph we build and that is going to be fixed in the next few days.
Okay, I got it. I hope my error analysis does not bring you extra work.
Thanks, and I wish the problem can be resolved as soon as possible.
Regarding things like "I only import X libraries":
A file you write may only import a few things, but those libraries have their own imports (which we need to analyze; consider a library which imports another by doing from foo import * to get everything into the same place, or tensorflow whose __init__.py imports every module in the library, and more). Typically, this isn't a big deal. On my machine, import numpy only takes a few seconds to fully analyze, and import tensorflow around 10 seconds. Analyzing scikit-learn (the project itself, not as a user importing it) is similar.
Where this can become an issue, though, is for libraries which have "optional" imports, meaning that they try-except importing libraries to define optional functionality. In large environments with many packages installed (especially conda installs which seem to install a slew of packages), those libraries, which when used alone are quick, will no longer be all that simple to analyze. For example, inside part of pandas there's a function which does:
    try:
        from qtpy.QtWidgets import QApplication
    except ImportError:
        try:
            from PyQt5.QtWidgets import QApplication
        except ImportError:
            from PyQt4.QtGui import QApplication
Which means that we have to go look at three potential versions of Qt libraries, which a big environment may have (but never actually use). One extra library to analyze isn't a problem in and of itself, but this compounds pretty heavily with large libraries which have a lot of functionality in environments which have installed the world.
in environments which have installed the world
Just tested the new 0.2.34.0 version of Python Language Server in such an environment - WinPython-3.7
on a workstation (Intel Xeon Gold 6134 CPU @ 3.20GHz 3.19 GHz (2 processors) with 192 GB RAM, just to be sure...)
On a moderate project using numpy, scipy the analysis took ~30 min with peak memory consumption (Microsoft.Python.LanguageServer.exe process) ~31GB (up 8800 items left...). For version 0.2.31 peak memory consumption was ~83GB in a comparable time.
Strange enough, for Anaconda3 distribution the analysis (the same python project) took only ~3 min with peak memory consumption <3GB (up 2200 items left...)
What are you using to track the memory usage? That's one tough thing here as well; the language server is in C#, which means that the memory usage is linked to how the GC behaves. If the system doesn't "need" the extra memory at a given point, it may not appear to release it.
83 to 31 is at least an improvement for now, though...
You'd need to look at what WinPython includes versus what you have installed in the Anaconda environment; see my previous comment. The part where Anaconda only shows ~2k items to analyze versus WinPython's ~9k sounds like an example of what I was describing. We'll probably also test it out and see.
What are you using to track the memory usage
details tab in TaskManager (Windows 10), Memory (private working set) column
You'd need to look at what WinPython includes versus what you have installed in the Anaconda environment
The both environments are as was downloaded
@jakebailey wouldn't it be possible to defer loading of libraries non imported directly by the current project until it is actually needed?
Using the example of pandas, personally I very rarely use anything that uses QT, so in most cases the language server you parse the QT library in vain.
I guess the same would be true for most large libraries that have lost of optional features
That doesn't really work. The types of variables/functions/etc in a given library can depend on another library, so in order to provide accurate info about any given library function, we need to analyze its dependencies. It gets even worse with scoping where a module can import something from one library and re-export it as its own.
What we have considered is adding a blacklist where a user could say "please don't analyze these modules", which is a workaround, but haven't yet have the time in favor of trying to get the rest worked out.
Using VSCode on macOS Mojave 10.14.4. VSCode is now unusable with the new Python updates. On my Macbook Air with 4GB total memory Microsoft Python Language Server uses 8GB memory (including swap) and this keeps on increasing infinitely. Chrome and all other apps just get stuck too due to this. I had to Force Quit VSCode from the Activity Monitor. Switching to Atom temporarily until this is fixed. Really bad experience!
@sheikhumar93 - which version of LS are you on. However, generally speaking if you use something like tensorflow, 4GB machine is going to work hard. There are 2500+ files in the library.
@jakebailey , @MikhailArkhipov
Thank you for the quick response, and the new update. Will test it out today. I will leave it to the experts on how to solve the issues.
@MikhailArkhipov I cant seem to find the Language Server version though Python extension version is 2019.3.6215 and VSCode version is 1.32.3. After my earlier comment I opened up VSCode again just now and it installed a new version of the Language Server and memory usage is considerably less than before (peaked around 3GB with 3000 files to analyse), but even after the analyses has ended it is using around 2.5GB of memory. Also when I quit VSCode and relaunch my project it starts to analyse all the 3000+ files again. Is this intentional?
@jakebailey yes, of course. What I meant was that it should be possible to stop the exploration at some point: re-using pandas and qt as example, the qt library could be explored only in the parts that are needed to type the pandas library. I'm not sure if it is implementable though
Regarding the update, after the new version the ram usage is still a bit high at about 1.6gb, compared to more than 10gb before. I think the older version (the one used before march) used about 0.5 Gb.
Still the extension is usable, and the analysis completes in a reasonable time.
Thanks
@sheikhumar93 - yes, if you use something like tensorflow package, it has 2500+ files. 2-3 GB would be normal. We expect some improvements in the near future, but there is no way around the fact that some packages are very large.
LS version is normally displayed in the output when it starts and you can also open the extension folder (Open Extensions Folder command) and look at the name of the languageServer.* folder.
I'm on MacOS 10.14.3 and, unlike the others, I don't get high memory usage (~600 Mb). Nor do I get the blue bar at the bottom for loading, even though I do import pandas and tensorflow in my files.
However, the LS uses a lot of CPU. It is constantly between 60% and 100%. And it is not clear why, since I don't get the analysis bar. Any ideas how I can investigate further?
@cipri-tom, perhaps you are on an older version? That was a more common problem with the 0.1.x releases (the latest is 0.2.x). Do you see a version number when it starts up? Else take a look in the extension files (use the "Open Extension Folder" command).
@gramster I have updated recently and, indeed, in the extension folder I see 2019.3.6215. The problem exists with this version. I have only opened a couple of files, extension memory is 145 Mb, but CPU continuously at 90-100% :( .
Should I try to do a trace? if it's in python, I could use pyflame
@cipri-tom - we would like to know LS version rather than extension version (they are different and not connected). LS version is displayed in the output when LS starts or you can get it from the languageServer.* subfolder of the extension. Is there is some progress displayed in the status bar?
Ah, sorry about the confusion.
I do not see the language server when starting up. Not after changing jediEnabled: false and reload. Not after quitting and starting VSCode from scratch and opening a Python file.
There is no progress displayed in the status bar. Just when I opened VSCode for the above test, I saw it was downloading the language server.
In my extension subfolder, I have:
- languageServer.0.2.37 -- date modified: 29 March
- languageServer.0.2.38 -- date modified: 30 March
- languageServer.0.2.40 -- date modified: 2 April (Today)
So, the above problems are with 2.27, 2.38 and 2.40 (just checked for this one).
I'm on macOS and VSCode just updated to LS version 0.2.40. On startup the LS shows "Analyzing in background, xxxx items left..." and the process takes about 15 minutes to complete, with CPU at >100% and RAM usage growing up to 3 GB.
This would be fine to wait for once. But the next time I start VSCode it goes through the whole process again. Can the analysis results be cached and reused?
Eventually, yes. This is #472
We've just built 0.2.41 to all of the download channels. This includes #866, which should be another memory usage improvement.
Despite 0.2.41, my Mac is still blocked on Analyzing in background. I let it more than one hour but it stays blocked. Is there any hint to correct that ? Is a downgrade to a previous stable version possible ?
I'm seeing the same thing as @lauevrar77 .
VSCode has be Analyzing all day and appears to be stuck (same file remaining count). It is still chewing up cpu cycles though.
Though the memory consumption is down 👍
Looks like I have a minimal repro:
from idna.uts46data import *
Seeing the same issue as @lauevrar77 and @jamesstidard on LS 0.2.41 -- mine is stuck with 4800+ items left and none of the autocomplete is working -- is there a way to downgrade to the earlier version which worked just fine ? Thanks.
I'm having the same issue with Python Language Server version 0.2.41.0:
Two cores at 100% usage, approx 5GB ram (and increasing), approx 1500 items left (and slowly increasing). The analysis has been stuck for an hour or more.
VSCode is usable anyway.
Hope you can fix this soon.
macOS 10.14.4, VS Code 1.32.3:
cpu 110% usage, 800MB ram, approx 5500 items left
I have been fighting this problem for two days and finally found the reason. Hope someb can fix it as soon as possible.
We're working on it; thanks for your patience.
0.2.42 has been built and pushed to all of the channels (containing #873); it should fix the hangup introduced in 0.2.41.
I am still getting the issue on 0.2.43. What's even worse is that whenever I open up a second vscode window that has python code in it, there are two of these processes concurrently, or if one has finished and I open up a second window, then it does the scan all over again, leaving me with 2 languageserver instances that's hogging a lot of RAM.
@jialutu - Two VS Code instances are completely isolated. There is no communication between them by design (as many parts of VS Code are also separate processes since it is built on node.js). VS Code controls how LS is launched and communicated with.
Large libraries like tensorflow contain thousands or files so memory consumption around 2G is normal.
Is there a way to disable the LS? Memory usage on Mac is still not acceptable at all - I don't want to waste more than 6GB of memory for a 30 line python script.. Using MS Python 2019.3.6558 and LS 0.2.47
Same way it was enabled, I guess, set python.jediEnabled back to true. Size of the Python script is not actually the issue. A single import of tensorflow means 3000 imported files...
The LS is opt-in in VS Code; you can remove the setting that enables it in your user settings, i.e. set jediEnabled back to true.
Enabling Jedi does not help that much, but if you want to disable the Problem, you can set a Python Path to an Python with out any packages installed. That works the best for me. This way at least snippets still work.
Same issue. Imported pandas, the language server spiked usage on my machine. Analysis stalled and never completed.
I have a similar problem when opening vs code the python language server - analyzing in the background brings the memory usage up to 2G. Coming from the microsoft.python.language server
Depending on the environment and imports, it's not unusual to see memory usage that high. Since the creation of this particular issue, that usage has been brought down a significant amount, but there's a limit without more restructuring.
same issue.
jedi slow and MS high memory usage.
It's seemed that the problem already has no been solve,so I have to disable visual studio intellcode, and enable jedi instead microsoft python analysis engine.
But, there also some problems, like the code can not autocomplete and identification the given variable function.
When using sublime text3 with anaconda, it worked perfect,so you know my meaning. heihei.
I had the exact same issue using every version up to the last once : 0.2.66.0 of the python language server and except the quoted solution, nothing helped at all.
Why not make that process part of the upgrade/installation of the server, since it obviously solves the high memory/cpu usage?
[snip that does not help] if it doesn't, use
Open Extensions Foldercommand and deletelanguageServer*subfolder in the Python extension, then restart VS Code.
Make what process a part of the upgrade? The process of deleting the folder and it getting downloaded again is the update process itself; the extension does this automatically when there's a new version to fetch. Deleting it is just a way of forcing the update to happen immediately (and get to the latest version).
@jakebailey : yes, deleting the content of the folder. If it is the standard process, I'm surprised that the extension began to be usable only after I deleted manually everything that was in this directory. Nothing else worked before. And I know that the extention was upgraded not too long ago, since I saw it being downloaded.
But now I know what to do if it starts again to show the same behaviour, so I'm ok with that.
And of course, many thanks for the efforts, this extension is really incredible!
@wj-c what number would you consider acceptable.
650M
We have fixed several issues with memory consumption in 0.2.74, which is now available in beta channel.
@MikhailArkhipov 69 GB is normal for you? For me (and my MacBook) it is crazy high, somehow someone forgets to optimize his code, I think all the Python libraries I have on my laptop are less than 70 GiB (including things that are not supposed to be exposed to Python intelli-sense). This is some kind of black magic big memory data creation piece of software, since a few months.

That is not normal, that is a bug. We have been working for many weeks on performance improvements, including memory usage. At the latest revision, analyzing tensorflow on my machine only uses 400 MB, as opposed to the multiple gigabytes it used to take. If you have a project which reproduces it, we'd love to test it and figure out why that would occur.
Also, try switching up to the beta release, which has many more improvements not yet in stable.
"python.analysis.downloadChannel": "beta"@jakebailey : I had my laptop running with no swap partition, as I thought naively that I would not need any with 16Gb of RAM. After it became clear that I could either stop using vscode or check what would happen with a swap partition, I decided to try the latter before the former.
And things are running smoothly now.
The Python Language Server still uses a lot of memory (I have two instances of code running simultaneously, and combined, they use almos 4Gb of RAM, which explains why every single time the language server needed to run, it brought my laptop to its knees, since there was no memory available), but at least, the system has a way out now.
Where can we set this?
Couldn't find this setting:
"python.analysis.downloadChannel": "beta"
In VS Code, use the command palette to open your settings as JSON, and add it to the configuration.
@MrTango it is not a public setting, so it will get squiggled.
I found that the python language server, running on RHEL7, seemed to have a thread leak: it kept spawning new threads until it reached my per-user process limit and started failing. After configuring VS Code to use the python analysis beta channel, it now spawns a reasonable number of threads and does not keep growing.
0.2.74 was promoted to stable; is that the version that had the leak before you switched? (Beta is now 0.2.76 which contains another change, though I'm not sure if it would have affected what you describe.)
@jakebailey I don't actually know which version I was using prior to setting the beta channel. But I had just updated VS code several days ago, and switched to the beta channel just about half an hour ago.
Using: "python.analysis.downloadChannel": "beta"


Hey Velizar, can you try to post a repo for us? From our telemetry, the 90th percentile memory use per session is now about 1.3GB; the 99th percentile is under 10GB, so 30GB is very unusual, and it would be helpful to understand what is going on in your environment to cause that. We have been working hard on bringing memory use down but there may still be bugs we haven't squashed that are occurring with some packages.
Well I've just reported that importing pandas is using half a GB of memory and it seems that, by the standards here, that's quite low :). Anyway, there is the startup time issue too. Each time I restart code it takes 30 seconds to 1 minute to get the language server functional for those big namespaces again. Jedi works quite better in this respect (lower initial latency and lower memory usage), despite working quite worse in other fronts.
I receive chrome://global/content/elements/notificationbox.js:[some number] unresponsive error before the server is out of more RAM or swap. Killing the server quickly after starting vscode seems to fix the issue.
The code currently I'm working with:
https://gist.github.com/tejasvi/11777404af5fa5ab57fd7918b4dcf031
That is not normal, that is a bug. We have been working for many weeks on performance improvements, including memory usage. At the latest revision, analyzing tensorflow on my machine only uses 400 MB, as opposed to the multiple gigabytes it used to take. If you have a project which reproduces it, we'd love to test it and figure out why that would occur.
Also, try switching up to the beta release, which has many more improvements not yet in stable.
"python.analysis.downloadChannel": "beta"
Where am I supposed to put the setting? It isn't recognized in ctrl+,
In your user settings.json, which you can find by opening your command palette and searching for "JSON".
#1133 and #1134 should have improved the case. #1134 is a significant change so version was bumped to 0.3. We just published it to daily and we will let it bake for 2-3 days. If nothing goes wrong, then we'll push it to beta and then to stable.
I am going to close this issue. Please open separate cases for specific sets of libraries or repro steps, like #1157.
Thanks!
I'm having again high memory usage problems on 0.3.20.
These seems to be a leak somewhere: it finishes analyzing fine using about 1gb.
Then over time it will increase to 10gb+.
Should I open a new issue?
Yes, please.
@jakebailey I've opened issue #1298.
Running my python code in the terminal and editing it in vscode. After aborting the program and even closing the corresponding vscode window, `Microsoft.Python.LanguageServer' fluctuates between 500 MB to 1.2 GB on my memory. I'm using version 0.3.39 on mac btw.
@hoveidar - this consumption is not unusual if you use large libraries, like, say, use tensoflow. Also, this number is not necessary memory that is held. Managed code like C# or Java releases memory when there is memory pressure in the OS, not immediately, like C++. Thus, if machine has 8GB RAM with 2GB free it may show smaller consumption number than machine with 64GB with 32GB free since runtime simply does not see reasons to release the memory pool back to OS.
This thread is closed so please report specific problems by opening new issues. Each case is different and may need separate investigation by different developers.
Not sure why you guys defending this so hard. Its obviously broken!
Frequently it gets stuck scanning for dependencies. I have to restart my cheap laptop after max 30 minutes as it almost freezes.
I thought this is related to the fact that this an old cheap machine. However, now I am at work with a newer PC. I just had to set myself to technical issue and restart the machine as it was about to freeze completely. At least the session was longer the 30 minutes before it happened.
Still, its undeniable that this is related to the python language server.

This isn't a defense or a statement that no issues exist; we're asking that this 4 month old closed issue about a different bug (but with potentially similar symptoms) not be used as the place to talk about a new issue. The analysis not completing may or may not have something to do with memory usage, but in any case is not going to have the same fix as what has been made here.
Note that #1298 is ongoing about a recent memory issue, with some progress made, but the discussion of that issue should happen there, not here. If you can reproduce your issue of the analysis never completing, please do open another issue so we can look into it. Thanks.
I love using VSCode with Python extension but I am having lately the same issues presented here. VSCode with Python extension cosumes massive amount of memory rendering the system unusable! It is consuming 5GB of RAM! The consumption is in some cases even higher than that. I am working on a laptop with only 8GB of RAM. I am using Windows 10, latest version of Python 3.8, VSCode is updated to latest version (March 2020). I mean this is ridiculous! Any solution yet!
Couple things. First, I'd suggest opening separate issue rather that posting in a closed thread. Each issue is different, there is not much of a common ground - i.e. there is no 'bug' that explains memory footprint in all cased.
Second, it depends what libraries do you use. Some libraries are very large, literally thousands of modules. Multiple data science libraries yield tens of thousands of files. As with other typeless languages, figuring out what particular function might be returning in Python, or what type some variable might have becomes quite expensive. Without type annotations or stubs it literally means walking though every code line in a library looking for what particular code branch might be returning or what members it might be adding to a class.