This Repo helps creating and debugging prometheus relabel configs and recording rules by running a local prometheus instance that scrapes metrics from a static file.
- podman or docker
- podman-compose or the docker equivalent
This short guide will be using
podman-compose. If you're ondocker, you should be able to just substitutepodman-composewithdocker-compose. But i did not test it with docker-compose.
Start the stack using podman-compose:
podman-compose up --force-recreate
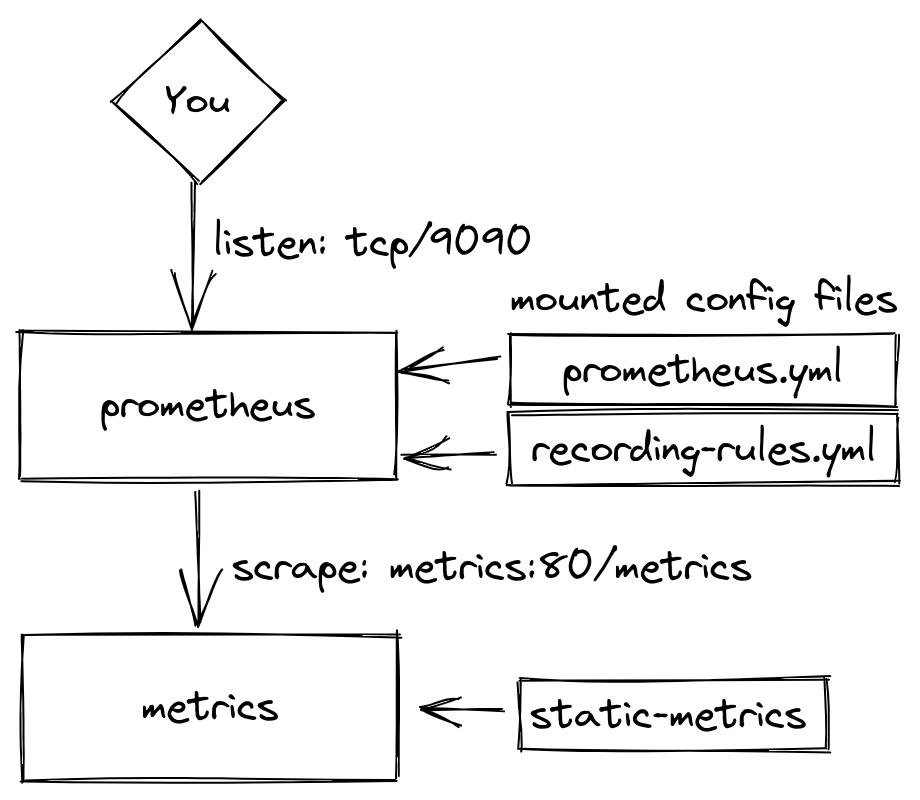
This will spin up prometheus and the static metrics server. The stack looks like this:
The prometheus UI will be made available under localhost:9090.
Changes to static-metrics should show up pretty immediately in the prometheus ui, as the scrape and evaluation_interval interval is only 1 second. (yes, that's not a lot. I don't like waiting)
For changes to the relabel-configs and recording-rules.yml to be effective, you will need to re-start the stack.
By uncommenting the last 4 lines from prometheus.yml and the code block starting at line 14 in docker-compose.yml, node-exporter will also spawn and be scraped by the prometheus instance. This give you a whole lot more non-synthetic metrics to play around with.
