This guide walks you through setting up Istio on a Kubernetes cluster and automating A/B testing and canary releases with GitOps pipelines.
Components:
- Istio service mesh
- manages the traffic flows between microservices, enforcing access policies and aggregating telemetry data
- Prometheus monitoring system
- time series database that collects and stores the service mesh metrics
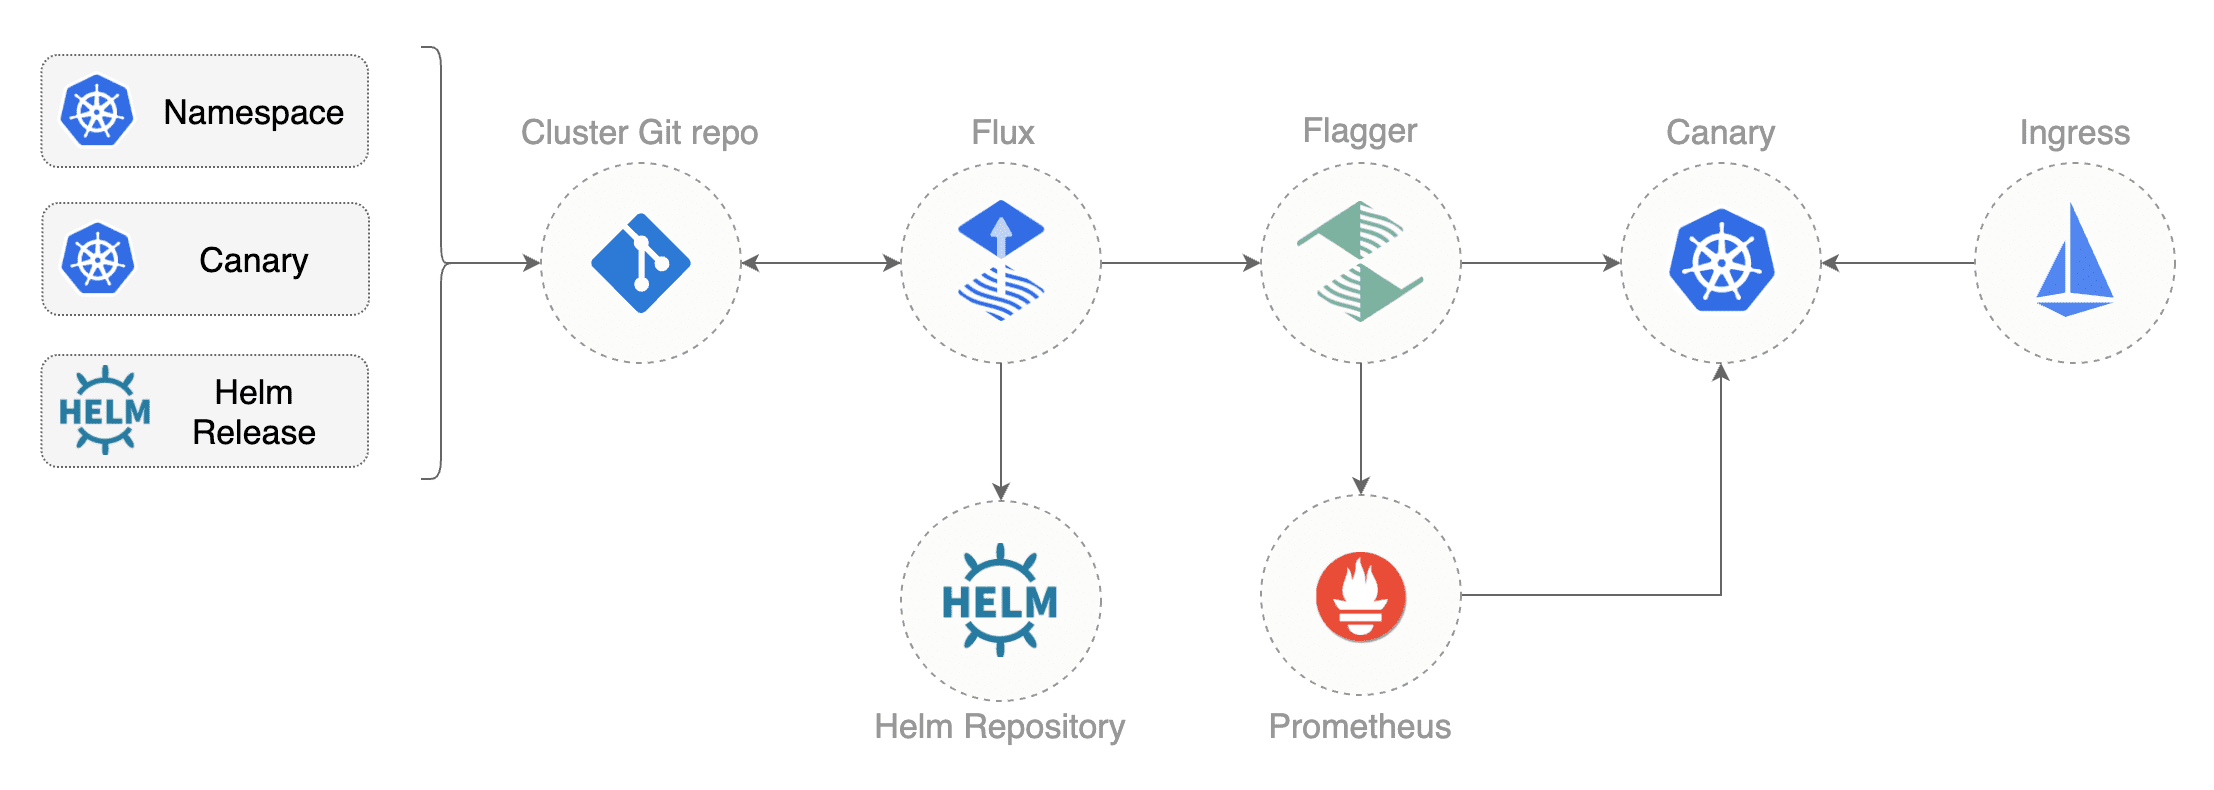
- Flux GitOps operator
- syncs YAMLs and Helm charts between git and clusters
- scans container registries and deploys new images
- Helm Operator CRD controller
- automates Helm chart releases
- Flagger progressive delivery operator
- automates the release process using Istio routing for traffic shifting and Prometheus metrics for canary analysis
You will need a Kubernetes cluster version 1.16 or newer and kubectl version 1.18. For a quick local test, you can use Kubernetes kind. Any other Kubernetes setup will work as well though.
In order to follow the guide you'll need a GitHub account and a
personal access token
that can create repositories (check all permissions under repo).
export GITHUB_TOKEN=<your-token>
export GITHUB_USER=<your-username>
brew install fluxcd/tap/fluxOr install the CLI by downloading precompiled binaries using a Bash script:
curl -s https://toolkit.fluxcd.io/install.sh | sudo bashcurl https://raw.githubusercontent.com/helm/helm/master/scripts/get-helm-3 | bashFork this repository and clone it:
git clone https://github.com/narrowspark/k8s
cd k8sInstall Flux and its Helm Operator by specifying your fork URL:
flux bootstrap github \
--owner=narrowspark \
--repository=k8s \
--branch=main \
--path=./cluster \
--components=source-controller,kustomize-controller,helm-controller,notification-controller \
--personal \
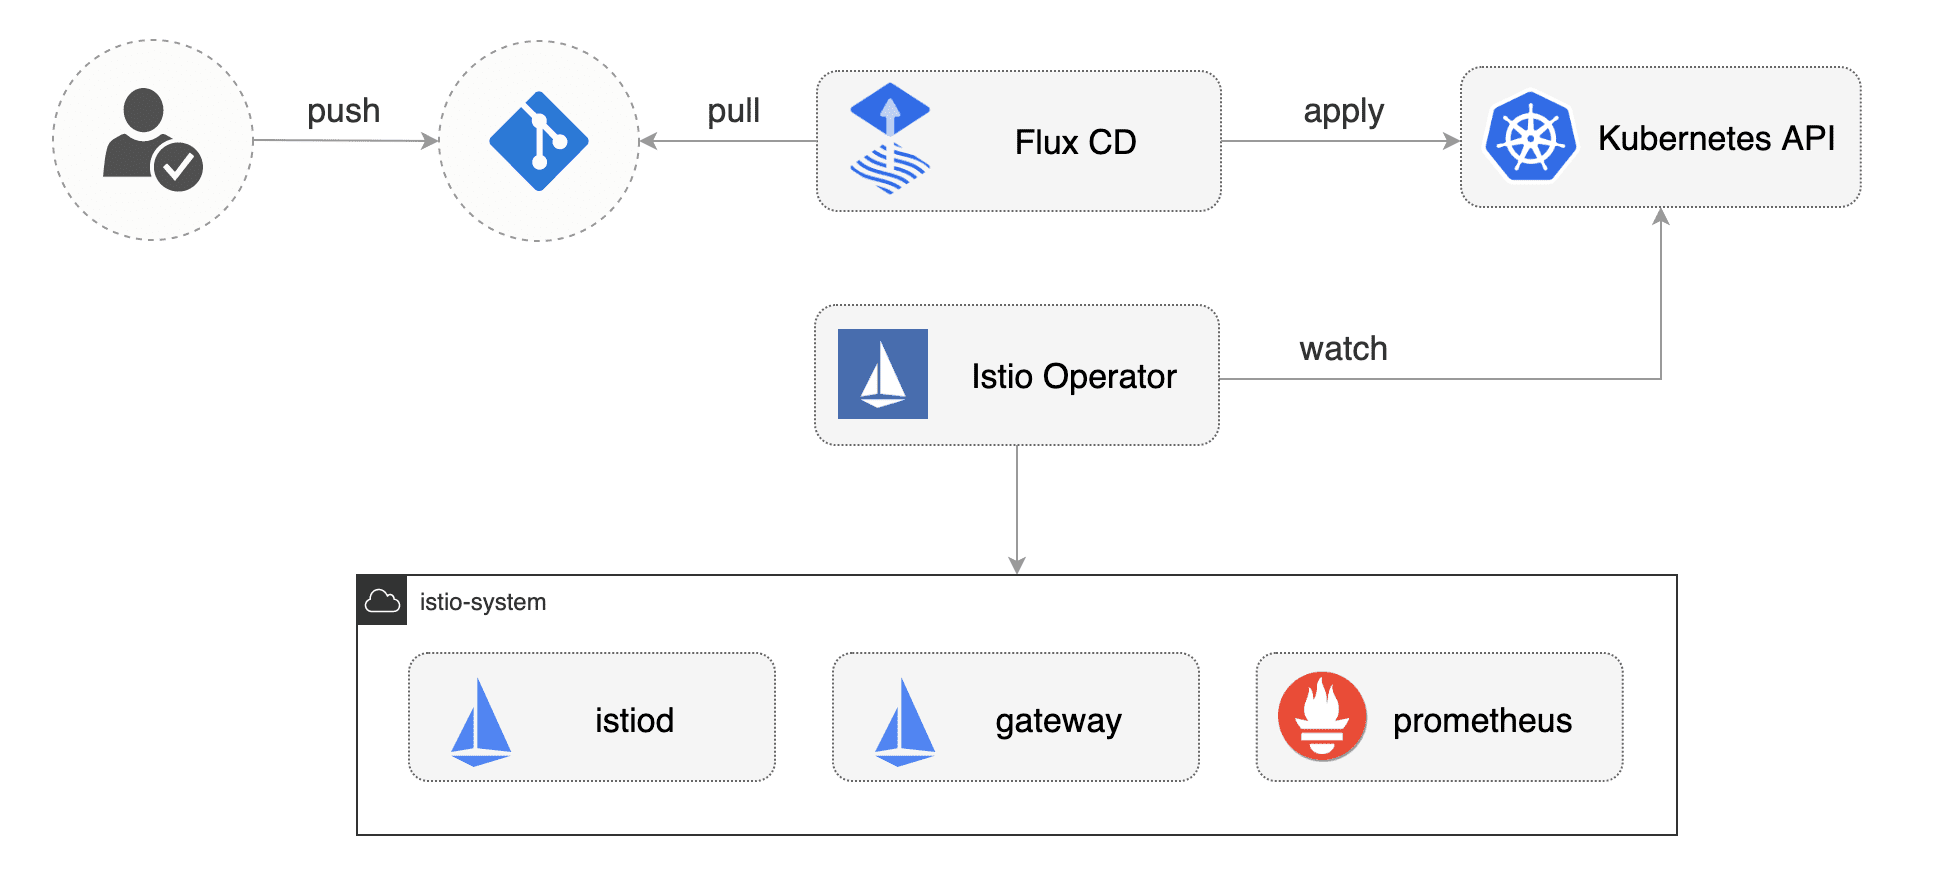
--privateAt startup, Flux generates a SSH key and logs the public key. The above command will print the public key.
In order to sync your cluster state with git you need to copy the public key and create a deploy key with write access on your GitHub repository. On GitHub go to Settings > Deploy keys click on Add deploy key, check Allow write access, paste the Flux public key and click Add key.
When Flux has write access to your repository it will do the following:
- installs the Istio operator
- waits for Istio control plane to be ready
- installs Flagger CRDs and Helm Releases
- creates the Istio public gateway
- creates the
prodnamespace - creates the load tester deployment
- creates the frontend deployment and canary
- creates the backend deployment and canary
Find the Istio ingress gateway address with:
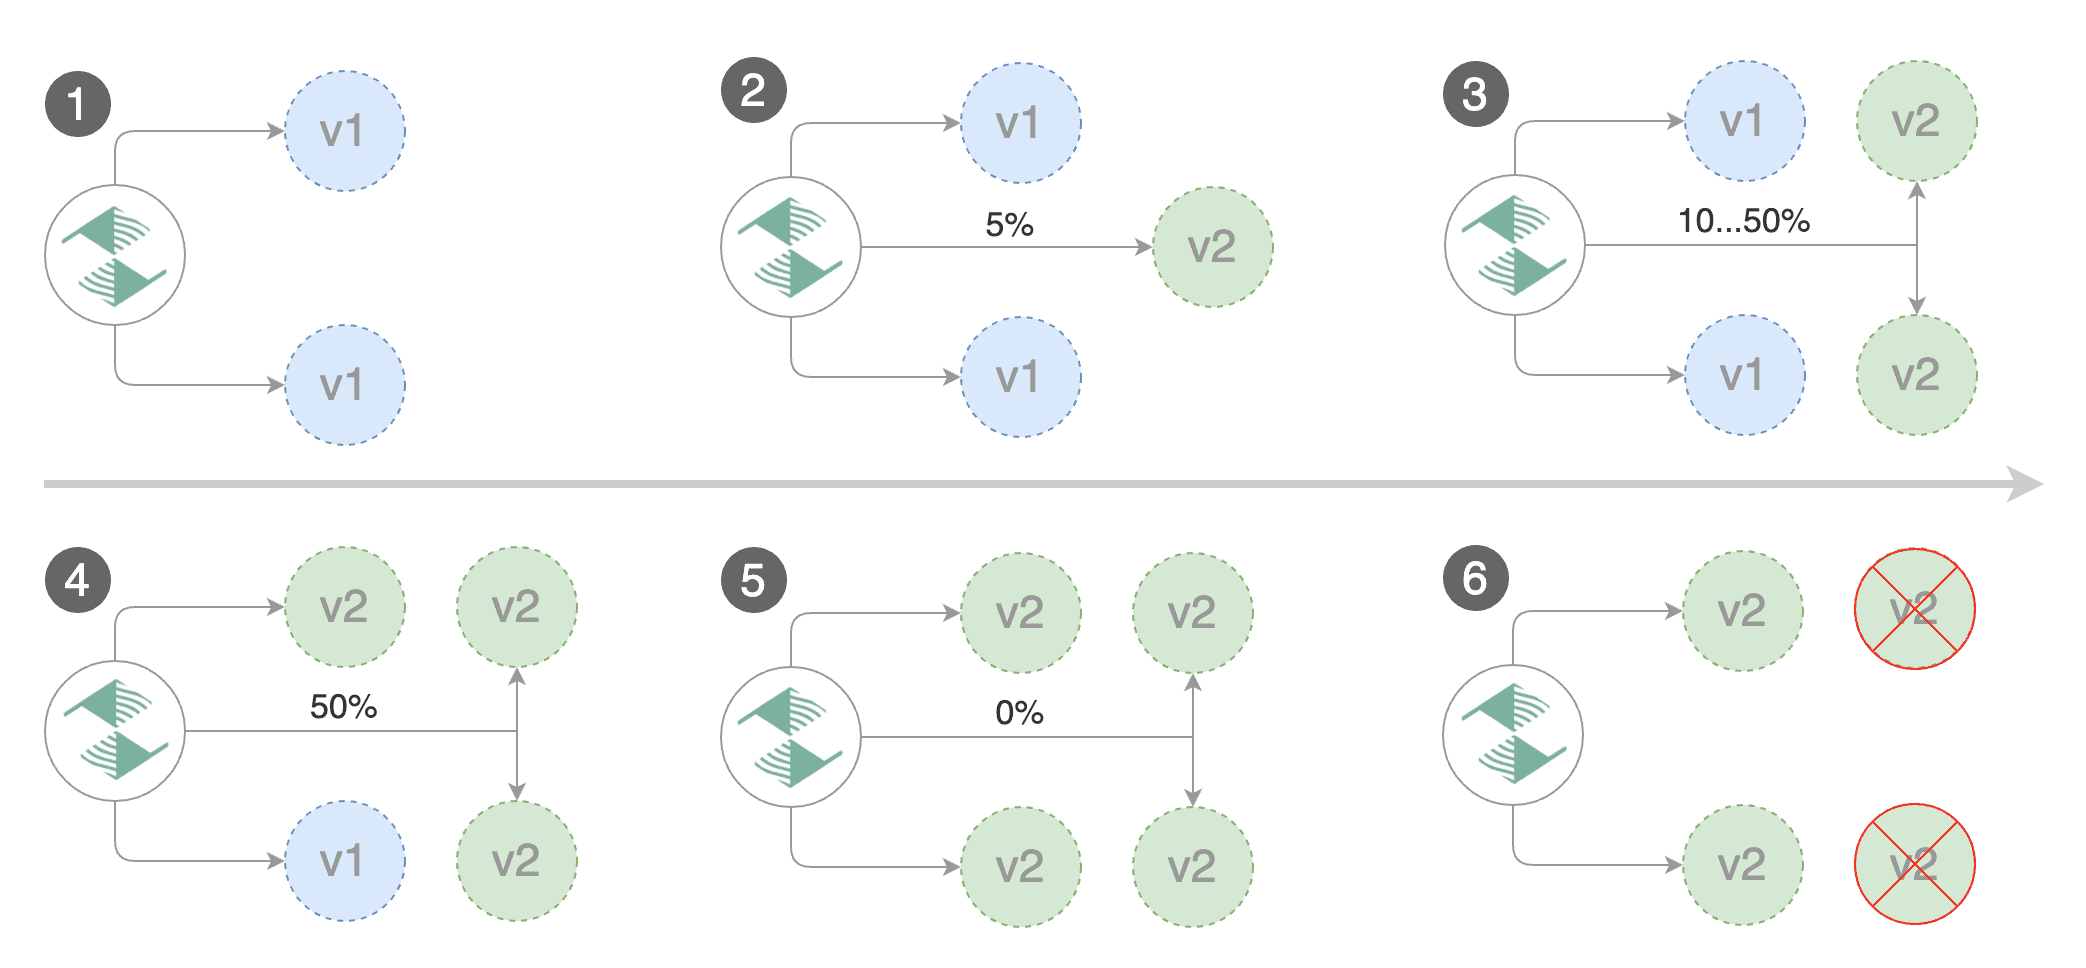
kubectl -n istio-system get svc istio-ingressgateway -ojson | jq .status.loadBalancer.ingressFlagger implements a control loop that gradually shifts traffic to the canary while measuring key performance indicators like HTTP requests success rate, requests average duration and pod health. Based on analysis of the KPIs a canary is promoted or aborted, and the analysis result is published to Slack.
A canary analysis is triggered by changes in any of the following objects:
- Deployment PodSpec (container image, command, ports, env, etc)
- ConfigMaps and Secrets mounted as volumes or mapped to environment variables
For workloads that are not receiving constant traffic Flagger can be configured with a webhook, that when called, will start a load test for the target workload.
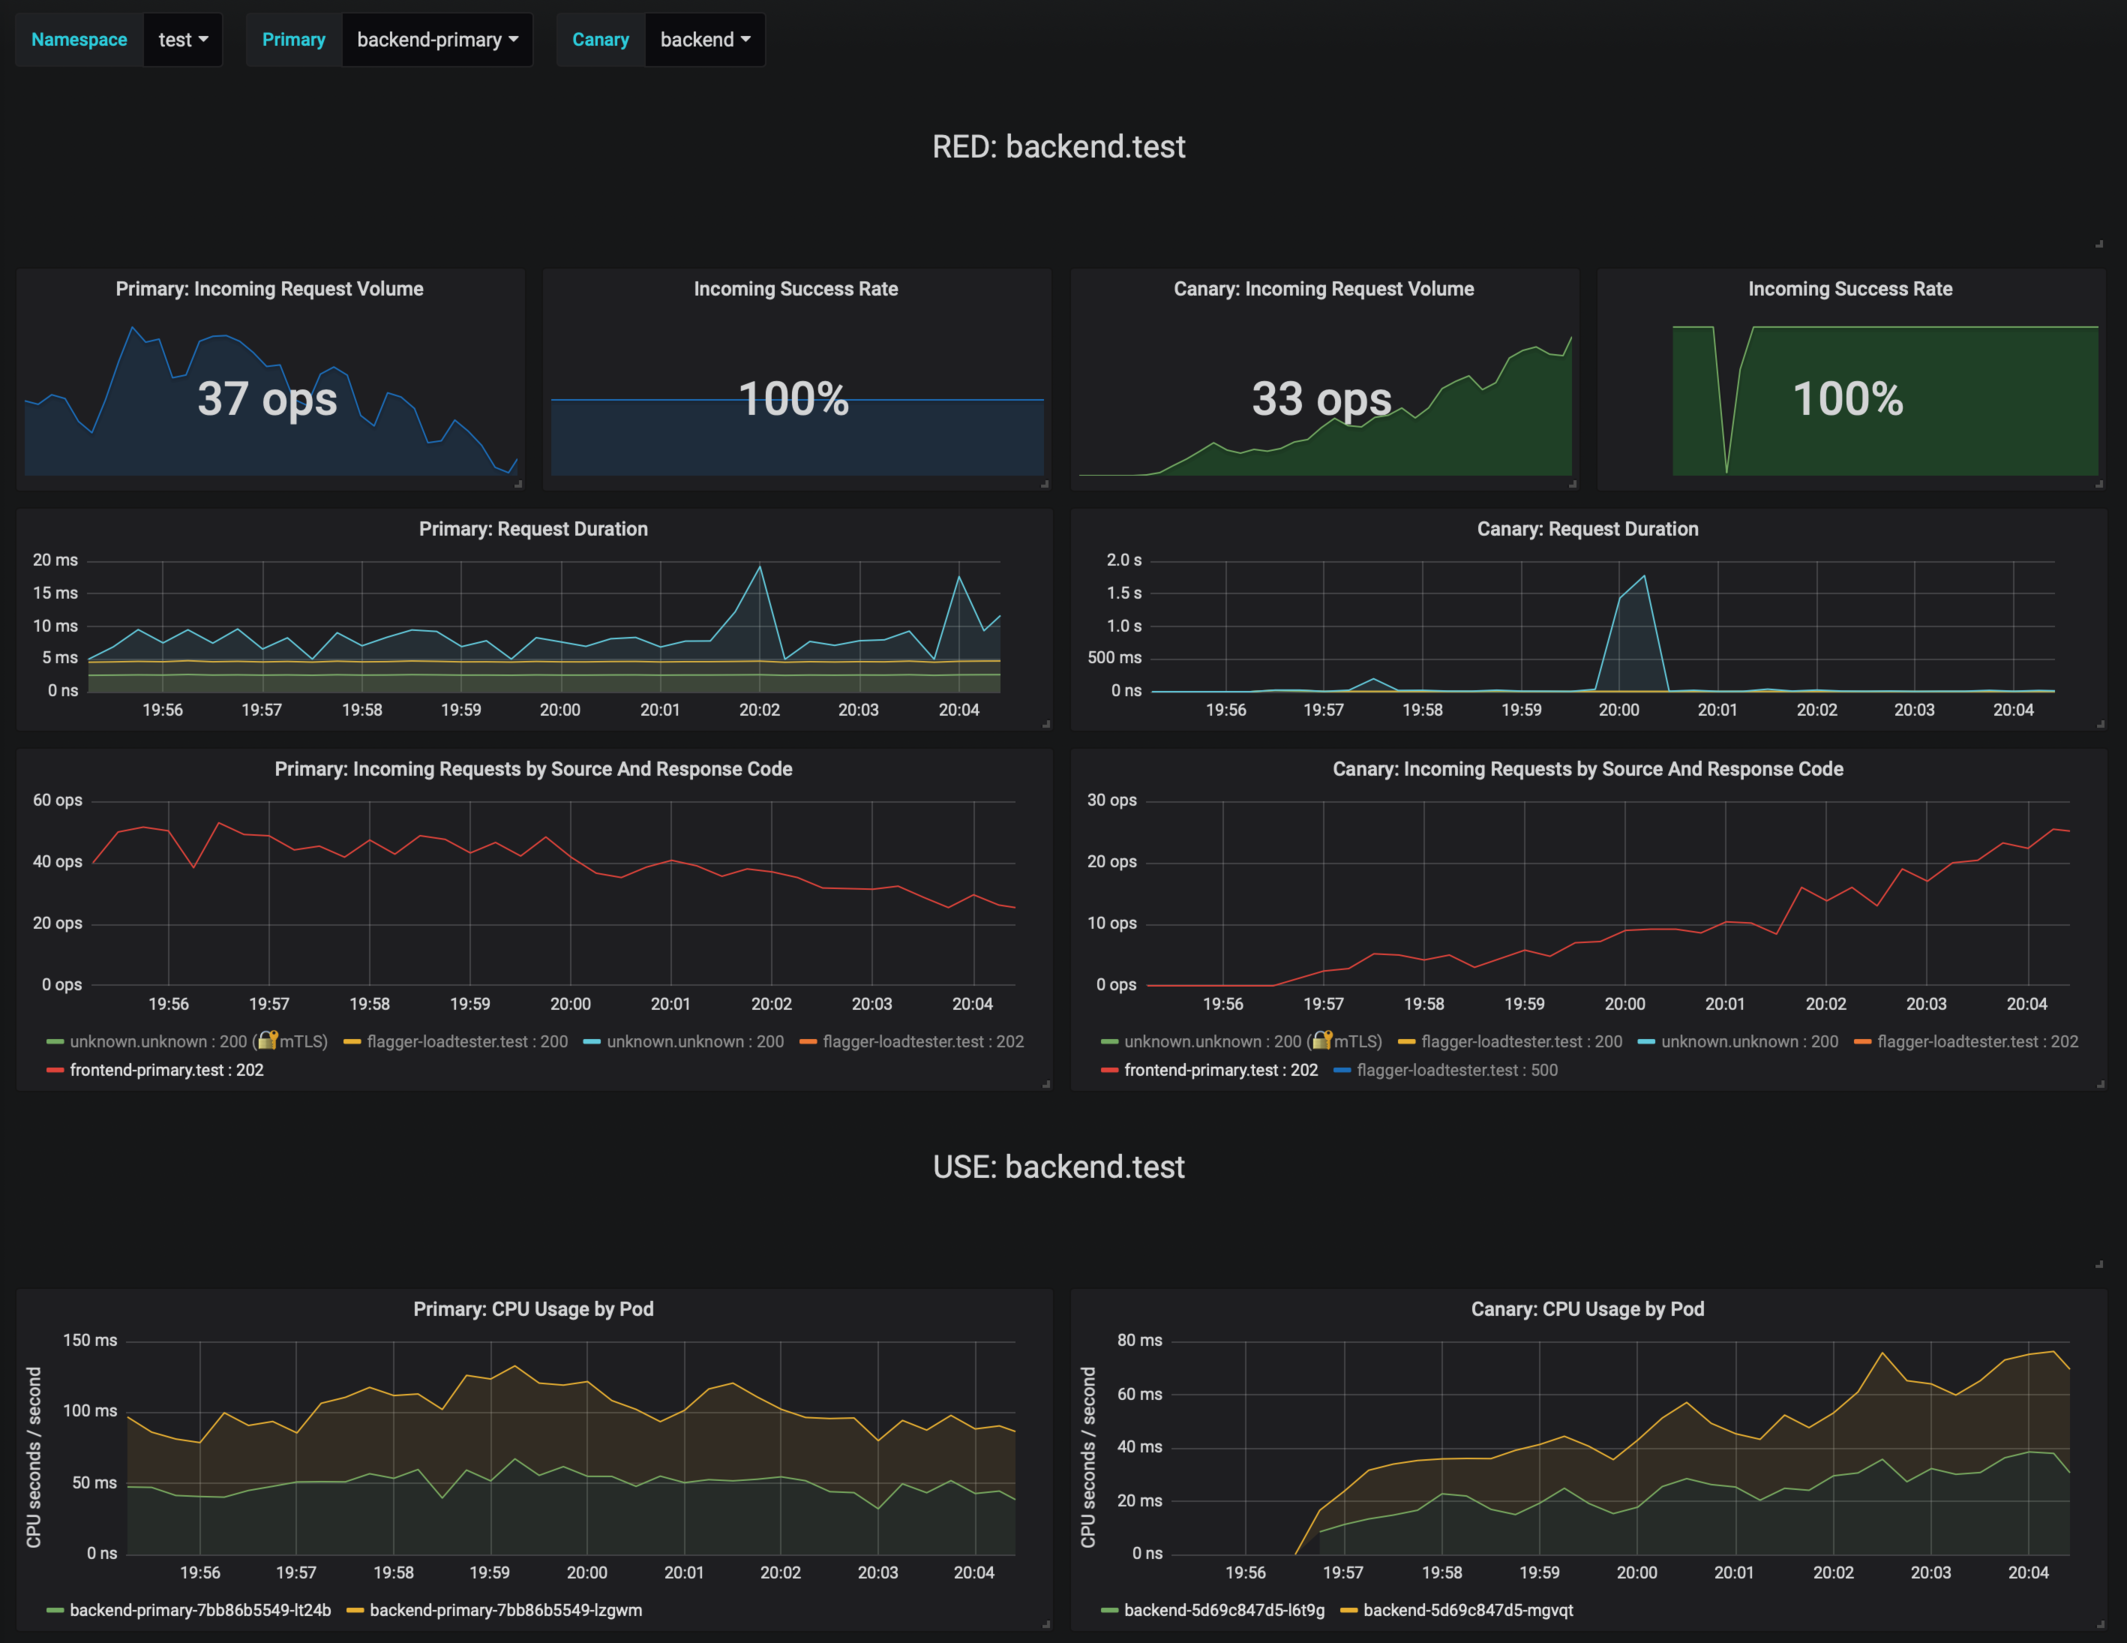
During the analysis the canary’s progress can be monitored with Grafana. You can access the dashboard using port forwarding:
kubectl -n istio-system port-forward svc/flagger-grafana 3000:80The Istio dashboard URL is http://localhost:3000/d/flagger-istio/istio-canary?refresh=10s&orgId=1&var-namespace=prod&var-primary=backend-primary&var-canary=backend
Note that if new changes are applied to the deployment during the canary analysis, Flagger will restart the analysis phase.
Besides weighted routing, Flagger can be configured to route traffic to the canary based on HTTP match conditions. In an A/B testing scenario, you'll be using HTTP headers or cookies to target a certain segment of your users. This is particularly useful for frontend applications that require session affinity.
You can enable A/B testing by specifying the HTTP match conditions and the number of iterations:
  analysis:
    # schedule interval (default 60s)
    interval: 10s
    # max number of failed metric checks before rollback
    threshold: 10
    # total number of iterations
    iterations: 12
    # canary match condition
    match:
      - headers:
          user-agent:
            regex: ".*Firefox.*"
      - headers:
          cookie:
            regex: "^(.*?;)?(type=insider)(;.*)?$"
The above configuration will run an analysis for two minutes targeting Firefox users and those that
have an insider cookie. The frontend configuration can be found at prod/frontend/canary.yaml.
Trigger a deployment by updating the frontend container image:
$ fluxctl release --workload=prod:deployment/frontend \
--update-image=stefanprodan/podinfo:3.1.1
Flagger detects that the deployment revision changed and starts the A/B testing:
$ kubectl -n istio-system logs deploy/flagger -f | jq .msg

New revision detected! Scaling up frontend.prod
Waiting for frontend.prod rollout to finish: 0 of 1 updated replicas are available
Pre-rollout check conformance-test passed
Advance frontend.prod canary iteration 1/10
...
Advance frontend.prod canary iteration 10/10
Copying frontend.prod template spec to frontend-primary.prod
Waiting for frontend-primary.prod rollout to finish: 1 of 2 updated replicas are available
Promotion completed! Scaling down frontend.prod
You can monitor all canaries with:
$ watch kubectl get canaries --all-namespaces

NAMESPACE   NAME      STATUS        WEIGHT
prod        frontend  Progressing   100
prod backend Succeeded 0Flagger makes use of the metrics provided by Istio telemetry to validate the canary workload. The frontend app analysis defines two metric checks:
    metrics:
      - name: error-rate
        templateRef:
          name: error-rate
          namespace: istio-system
        thresholdRange:
          max: 1
        interval: 30s
      - name: latency
        templateRef:
          name: latency
          namespace: istio-system
        thresholdRange:
          max: 500
        interval: 30s
The Prometheus queries used for checking the error rate and latency are located at flagger/istio-metrics.yaml.
During the canary analysis you can generate HTTP 500 errors and high latency to test Flagger's rollback.
Generate HTTP 500 errors:
watch curl -b 'type=insider' http://<INGRESS-IP>/status/500Generate latency:
watch curl -b 'type=insider' http://<INGRESS-IP>/delay/1When the number of failed checks reaches the canary analysis threshold, the traffic is routed back to the primary, the canary is scaled to zero and the rollout is marked as failed.
$ kubectl -n istio-system logs deploy/flagger -f | jq .msg

New revision detected! Scaling up frontend.prod
Pre-rollout check conformance-test passed
Advance frontend.prod canary iteration 1/10
Halt frontend.prod advancement error-rate 31 > 1
Halt frontend.prod advancement latency 2000 > 500
...
Rolling back frontend.prod failed checks threshold reached 10
Canary failed! Scaling down frontend.prod
You can extend the analysis with custom metric checks targeting Prometheus, Datadog and Amazon CloudWatch.
Flagger can be configured to send Slack notifications. You can enable alerting by adding the Slack settings to Flagger's Helm Release:
apiVersion: helm.fluxcd.io/v1
kind: HelmRelease
metadata:
name: flagger
namespace: istio-system
spec:
values:
slack:
user: flagger
channel: general
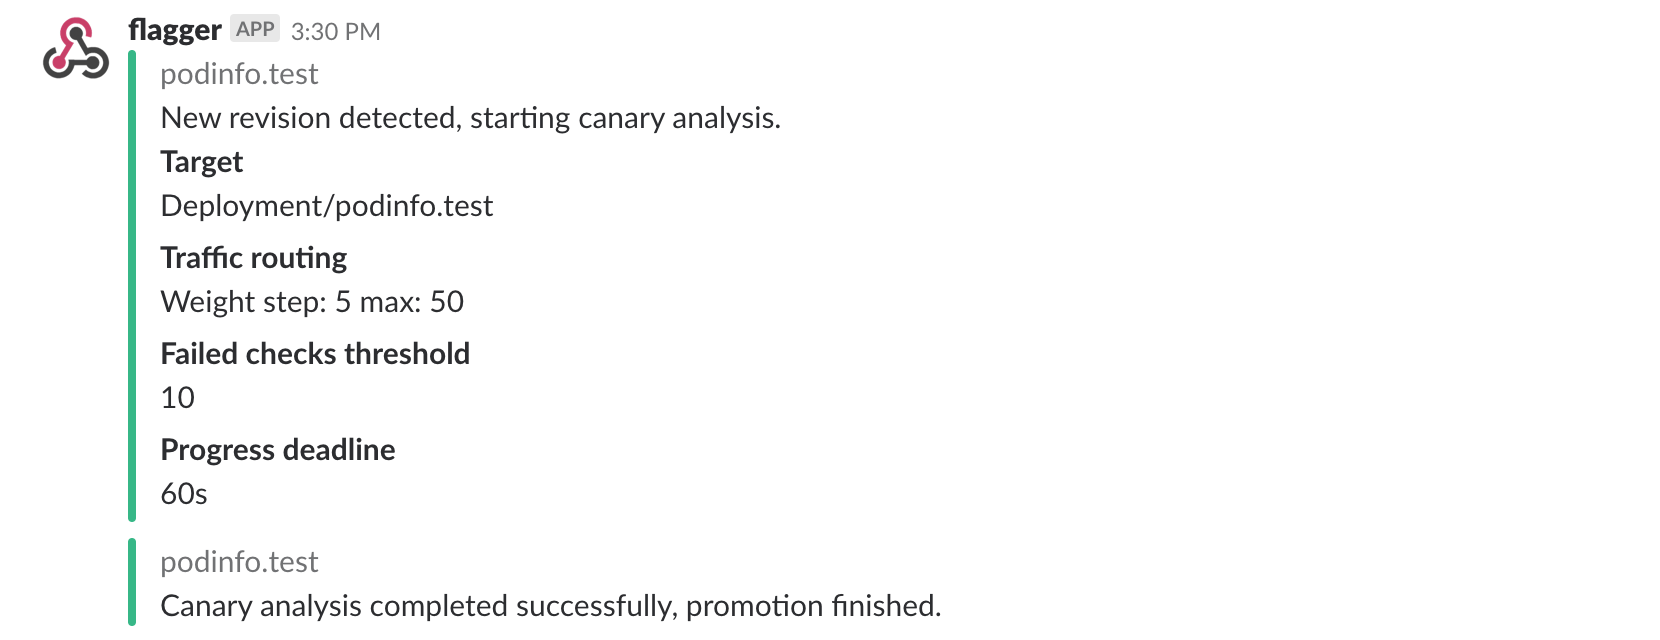
url: https://hooks.slack.com/services/YOUR/SLACK/WEBHOOKOnce configured with a Slack incoming webhook, Flagger will post messages when a canary deployment has been initialised, when a new revision has been detected and if the canary analysis failed or succeeded.
A canary deployment will be rolled back if the progress deadline exceeded or if the analysis reached the maximum number of failed checks:

For configuring alerting at canary level for Slack, MS Teams, Discord or Rocket see the docs.
If you have any questions about progressive delivery:
- Invite yourself to the Weave community slack and join the #flux and #flagger channel.
- Join the Weave User Group and get invited to online talks, hands-on training and meetups in your area.
Your feedback is always welcome!