There is alreadys kibana-auth repos wrote in NodeJs or RubyOnRails. However I don't familar with both those but can only write a little Perl5 code. So, I use Mojolicious web framework to do this.
I place all my auth code at kbnauth sub directory, if you don't want any auth, just use the original src directory.(In facts, I use symlinks for my kbnauth/public/*)
- full async proxy
You can control every requests sending to elasticsearch. I use config.js.ep for elasticsearch setting, and return a fake /_nodes response body which only has one node point to the webserver.
Note: Mojolicious set default max_message_size to 10MB, I change this setting to 0 which means indefinite size in script/kbnauth. You can change this to any threshold value you want.
2014.11.04: Now all requests send to ES asynchronously. It's a big improve for performance.
- using a elasticsearch
kibana-authindex for authorization
Since all the requests would send to the proxy server, every user would has his own namespace for dashboards(kibana-int-$username, yes, it's a common implement that kibana-proxy used. You can run ./script/kbnauth migratint username hisdashname... for quick migration) and can only access his own indices or even cluster.
2014.11.04: use Mojo::Cache to cache kibana-auth/indices/$user result. It's a big improve for performance.
You can add kibana-auth for user "sri" as follow:
$ curl -XPOST http://127.0.0.1:9200/kibana-auth/indices/sri -d '{
  "prefix":["logstash-sri","logstash-ops"],
  "route" :"/dashboard/elasticsearch/sri-dash",
  "server":"192.168.0.2:9200"
}'
Or (for windows user, you can use Strawberry Perl to do this directly)
perl -MHTTP::Tiny -MJSON -E 'say to_json(HTTP::Tiny->new->post("http://10.13.57.35:9200/kibana-auth/indices/sri", {content=>to_json({prefix=>["logstash-sri","logstash-ops"],route=>"/dashboard/elasticsearch/sri-dash",server=>"192.168.0.2:9200"})}))'Then "sri" can access the "logstash-sri-YYYY.mm.dd" and "logstash-ops-YYYY.mm.dd" indices stored on "192.168.0.2:9200". And he would see /dashboard/elasticsearch/sri-dash dashboard as homepage.
- using Authen::Simple framework for authentication
Authen::Simple is a great framework that support so many authentication methods. For example: LDAP, DBI, SSH, Kerberos, PAM, SMB, NIS, PAM, ActiveDirectory etc.
I use Passwd as default(using htpasswd commandline). But you can add/change more methods to kbn_auth.conf as follow:
  authen => {
    LDAP => {
      host   => 'ad.company.com',
      binddn => 'proxyuser@company.com',
      bindpw => 'secret',
      basedn => 'cn=users,dc=company,dc=com',
      filter => '(&(objectClass=organizationalPerson)(objectClass=user)(sAMAccountName=%s))'
    },
}I used carton to bundle the whole dependent libraries into vendor/cache. So you can install and run kbnauth as follow:
cd kbnauth
./vendor/bin/carton install --cached
./vendor/bin/carton exec local/bin/hypnotoad script/kbnauth
The code depands on Mojolicious and Authen::Simple.
cd kbnauth
curl -L http://xrl.us/cpanm -o /usr/local/bin/cpanm
chmod +x /usr/local/bin/cpanm
cpanm Mojolicious Authen::Simple::Passwd
morbo script/kbnauth # listen :3000 for development
hypnotoad script/kbnauth     # listen :80 for production, ports defined at kbn_auth.conf
For windows user, install Strawpberry Perl which bring cpanm already.
If you want use other authen methods, for example, LDAP, just run cpanm Authen::Simple::LDAP.
Tips: if you run the code at a clean RHEL system, you may find Digest::SHA need to install too. RedHat split Perl core modules to a special perl-core RPM. Run yum install -y perl-core to solve it. I HATE REDHAT!
Now you can login with init user/pass: "sri/secr3t". (this is the name of mojolicious creator)
Percentile is a great data analysis method. Elasticsearch add percentile aggregation support after version 1.1.0. But Kibana v3 use an outdate elastic.js which don't support aggergation! So I write this panel using native angularjs Merged new version of elasticjs at 2014/08/15, rewrite this panel now.(DONE at 2014/08/16)$.http api.
Add compression options to control PercentileAggregation, because percentile may be so slow. Saw http://www.elasticsearch.org/guide/en/elasticsearch/reference/current/search-aggregations-metrics-percentile-aggregation.html#search-aggregations-metrics-percentile-aggregation-compression for the reason.
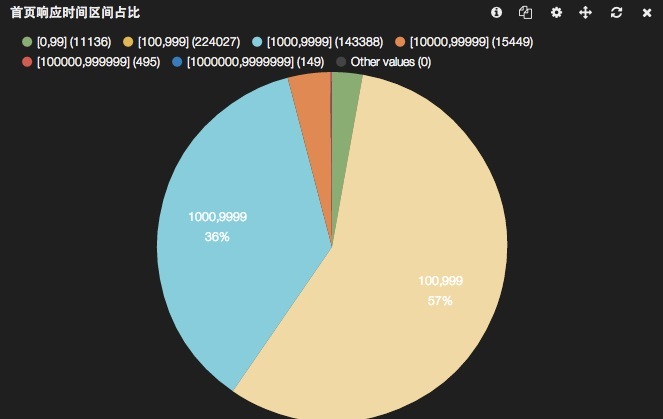
I need a pie chart to show percentile of range sections(percentile rank wait for only one value). So I use RangeFacet to implement this.
Here is the rendering:
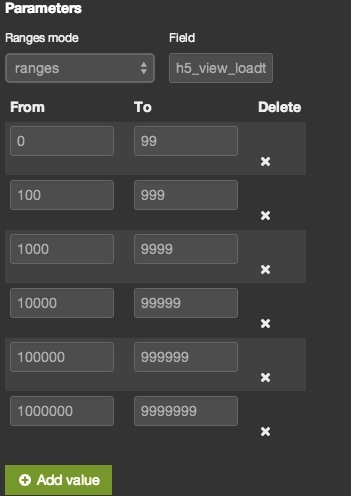
And you can add more range sections as you like:
Port kibana 4 exportAsCsv function back to kibana 3.
Note that I add the export icon in panelModal, so you may need add a "exportable":true into your exists dashboard json by hands, overwise it won't trigger the ng-show.
First, I re-implement histogram panel using the new aggregations api instead of facets api. The requst now is a nested aggregation with global/filter/date_histogram in turns. Then we can set stats aggregation as a sub aggr for "min/max/avg", and also cardinality aggregation for "uniq"! What ever you want could be added in the same way. Much thanks for aggr.
Attention: the cardinality aggregation was added in elasticsearch 1.1.0.
Offical blog about cardinality aggr: http://www.elasticsearch.org/blog/count-elasticsearch/
Now you can select different leaflet map providers from bettermap panel settings.
For chinese user, there is GaoDe(高德地图)!
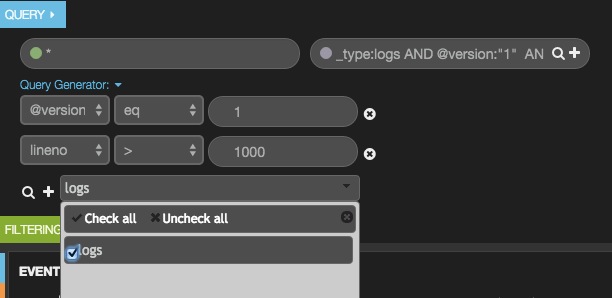
Fetch _type and fields from /_mapping API. and help you to generate some querystrings by click multi-select.
Use HTML5 Notification API to alert the outier value of queries.
Use map.cn.js from http://jvectormap.com/maps/countries/china/, delete CN- because filter/geoip don't have such prefix.
Add Taiwan to this map.
Many thanks to this author(@loveshell)!
Provide a way to choose the stat to display into the map, not only the total number of hits but also min/max/total etc.
Many thanks to this author(@eMerzh)!
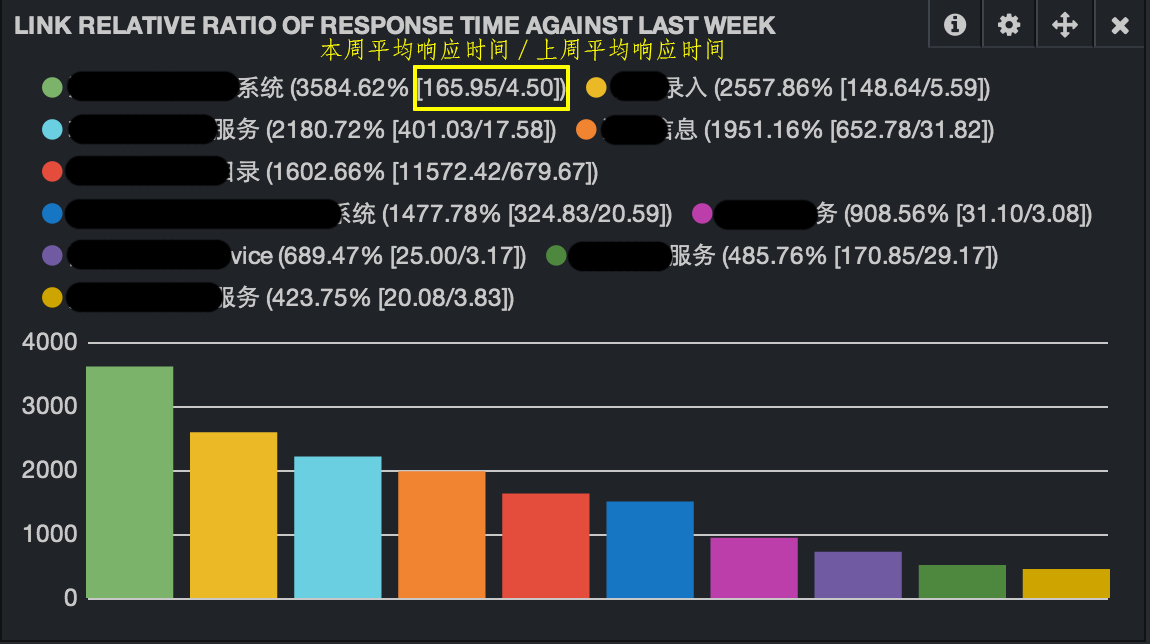
This panel is so useful if you want to check the trend of your statistic history.
Many thanks to this author(@opsSysDev)!
Enable histogram panel to plot multiple fields.
Many thanks to this author(@tvvmb)!
You can select one field to use right Y-Axis to show your data.
Enhances the histogram panel to support value-based histograms in addition to time-series histograms.
Many thanks to this author(@jdve)!
Adds refresh icon to kibana panel directive which broadcasts a refresh event down its scope chain.
Many thanks to this author(@thegreenpizza)!
- Angular is now at 1.2.20
- Elasticsearch JS now included
- Updated to the latest elasticjs
Add two configuration settings into config.js:
- sniff: now kibana would sniff all your nodes by default
- request_timeout: now kibana wouldn't render panels if your data return after 30 seconds
If you had wrote your own panels and want to migrate to the latest elasticjs, just change a few codes as follow:
request = $scope.ejs.Request();
results = $scope.ejs.doSearch(dashboard.indices, request);
$scope.inspector = request.toJSON();Add force panel of packetbeat.
https://github.com/packetbeat/kibana/commit/27cba54a73dd4246161df1bb1ed45d380588c6a5
hiddenable navbar
Add ng-show="dashboard.current.nav.length" into index.html. So now you can use dynamic script dashboard to show only panel without any other things. This is very useful if you want embed some panel chart into other systems.
See script dashboard at : <./src/app/dashboards/panel.js>
Support to define scripted field for terms/termstats facet. Just like what you can do in Kibana4.
You can click multi term.label lines, and then submit to set an either filterSrv.
Math.log() for valuehistogram panel(had try_.map(series, function(v){return Math.log(v)}), not so useful)- percentile histogram panel http://www.flotcharts.org/flot/examples/percentiles/index.html??
- heatmap panel http://www.patrick-wied.at/static/heatmapjs/plugin-leaflet-layer.html
threshold for histogram http://www.flotcharts.org/flot/examples/threshold/index.html(had try, not so useful, but I keep this commit in the repo)webkit.notification for histogramscript fields for terms panelMultiple axis support for multifieldhistogram
