What are the tall vertical lines on the graphs when the connection is bad? (documentation request)
Closed this issue · 2 comments
I am sorry for (mis-)using the issue tracker for asking a question, but I can later add the answer into the FAQ or the man page.
On my graph, I am seeing tall vertical lines starting at the graph, and ending at the top of the picture:
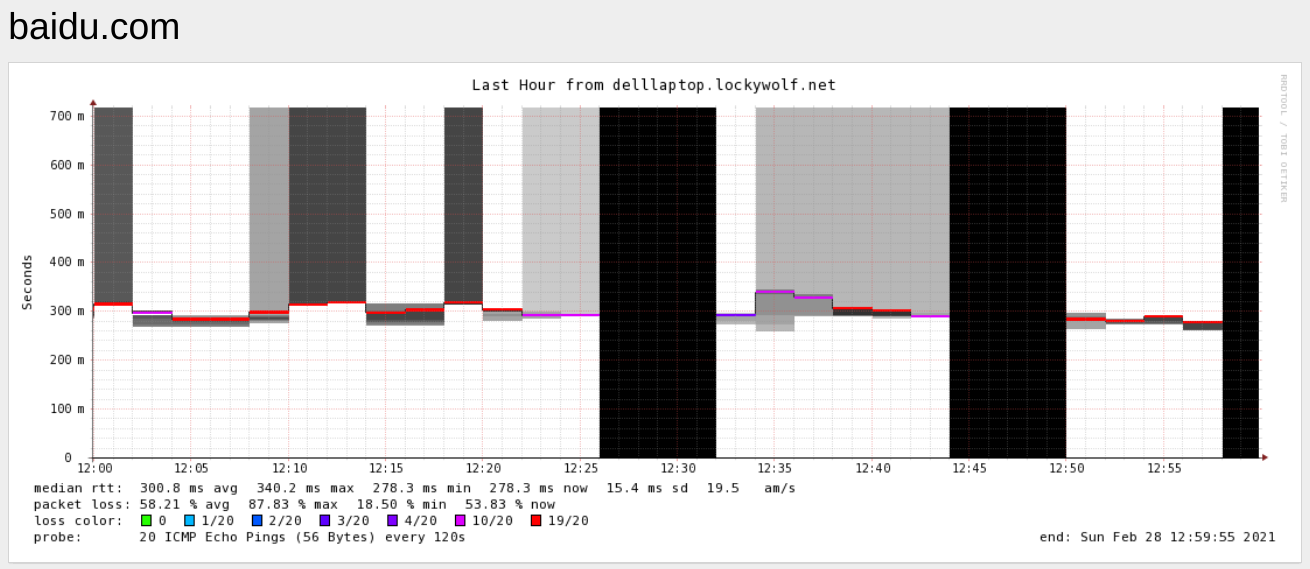
The some space is black, because the nodata_color = 000000.
I guess that the "tall lines" indicate either packet loss, or standard deviation.
It does not look so bad on the browser picture, but I am reusing this picture for a Conky representation on the desktop:

That's where the bright white lines (e.g. from 12:35 to 12:45) do not melt in so well.
I have loss_background = no and graphborders = no.
Can I somehow turn them off completely, or set a cap on whatever value they represent?
The grey and black lines are added by you, not the defaults. See https://oss.oetiker.ch/smokeping/doc/reading.en.html
So these are called "smoke", if I'm not mistaken.
loss_background = no makes the graphs more uniformly white, but I would want them rather uniformly black.
Is it possible?