Couldn't activate file - ini File with Global Function loaded at startup
Closed this issue · 3 comments
Hello Paul,
thirst of all, thank you very much for your development on MobDebug and ZeroBraneStudio !
Maybe it is working as expected, here my case:
Game --> XPlane 11 Flight Simulator --> Plugin Engine loads --> FlyWithLua
In this Plugin Environment can Lua Scripts run with "LuaJIT 2.0.5"
When this Plugin is loaded in Xplane, it reads in the first time an ini File with some Basic stuff plus delivered also a function --> function FLYWITHLUA_DEBUG(). Inside this function is logging etc ...
Source --> https://github.com/X-Friese/FlyWithLua/blob/master/FlyWithLua/Internals/FlyWithLua.ini
I can see it is loaded and presend in _G
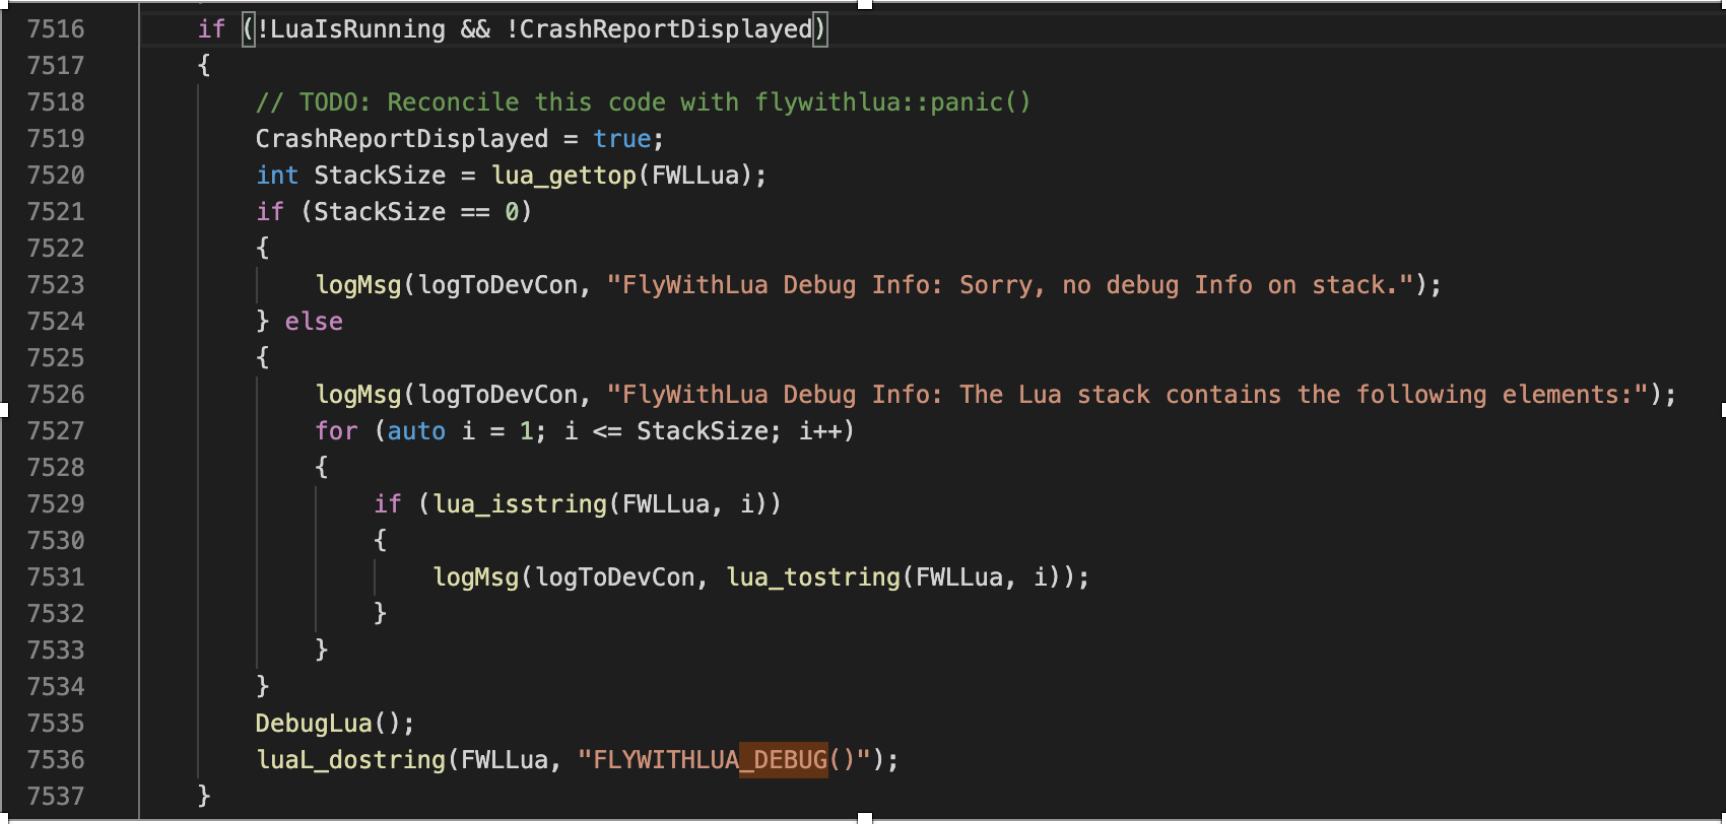
When now an issue inside a script is, calls FlywithLua on C side a luaL_dostring (line 7536)
Source:
https://github.com/X-Friese/FlyWithLua/blob/master/src/FlyWithLua.cpp
After i create a failure inside a "Module" as example i got this:
Couldn't activate file '/Volumes/SSD2go PKT/X-Plane 11 stable/Resources/plugins/FlyWithLua/flywithlua_debug()' for debugging; continuing without it.
And see nothing more, but the Debugger is always running, but can`t see where
Thanks in advance !
Greetings Lars
Edit: Sorry I forgot to write that I expected at least a step in here.
VERSIONS --> ZeroBrane Studio (1.90; MobDebug 0.706)
In all other cases is this what i use then to catch my issue afterwards:
-- Works like pcall(), but invokes the debugger on an error.
function dbg_call(f, ...)
	return xpcall(f, function(err)
    require("mobdebug").start()
    print( "ERROR: ", err )
		return err
	end, ...)
end


dbg_call(function()
	-- Put some buggy code in here:
    local toast = require("toast")
end)
@urbanswelt, I think it is mostly working as intended, but you may be running into an edge case.
It is possible to step into code loaded with loadstring, but it needs to be longer than one line (this is a side effect of not having a filename to load a fragment from to be provided, as luaL_loadstring doesn't have a parameter to pass the filename with; luaL_loadbuffer does though).
The message you see is a warning that the IDE couldn't figure out which source file to use to display the position where the execution was suspended, so it continued without stopping.
A simple workaround is to set a breakpoint inside FLYWITHLUA_DEBUG function itself.
See this FAQ answer for some additional information: https://studio.zerobrane.com/doc-faq#is-it-possible-to-debug-dynamic-fragments-loaded-with-loadstring.
Thank you very much for this edge case ! =D
I see it the other way round, we have to change the exception handling of FlyWithLua.
I have seen some comments that this is necessary ;-)
At the same time this coding (...debug...)can be packed into an init.lua. This probably makes the most sense.
Last question from my side, is it possible to react at least to the output string ?
I am describing debugging possibilities for the project and would have liked to write at least something that this message shows the error of the user script.
Greetings Lars
Last question from my side, is it possible to react at least to the output string ?
Depends on what you mean by this. There is debugger.outputfilter, which allows to filter messages coming during debugging, but it's not called on errors with stack traces.
By default, the error messages in the Output panel are "clickable" as long as the error message has recognizable format, which can be configured (see output.lineactivate at https://studio.zerobrane.com/doc-general-preferences#output).