docs - compass plot
danton267 opened this issue · 1 comments
danton267 commented
compass plots do not plot any resutls on the plots - https://github.com/plotly/plotly.matlab-docs/blob/main/matlab/2021-08-04-feather-plot.md
gilbertogalvis commented
This issue was fixed by PR #463
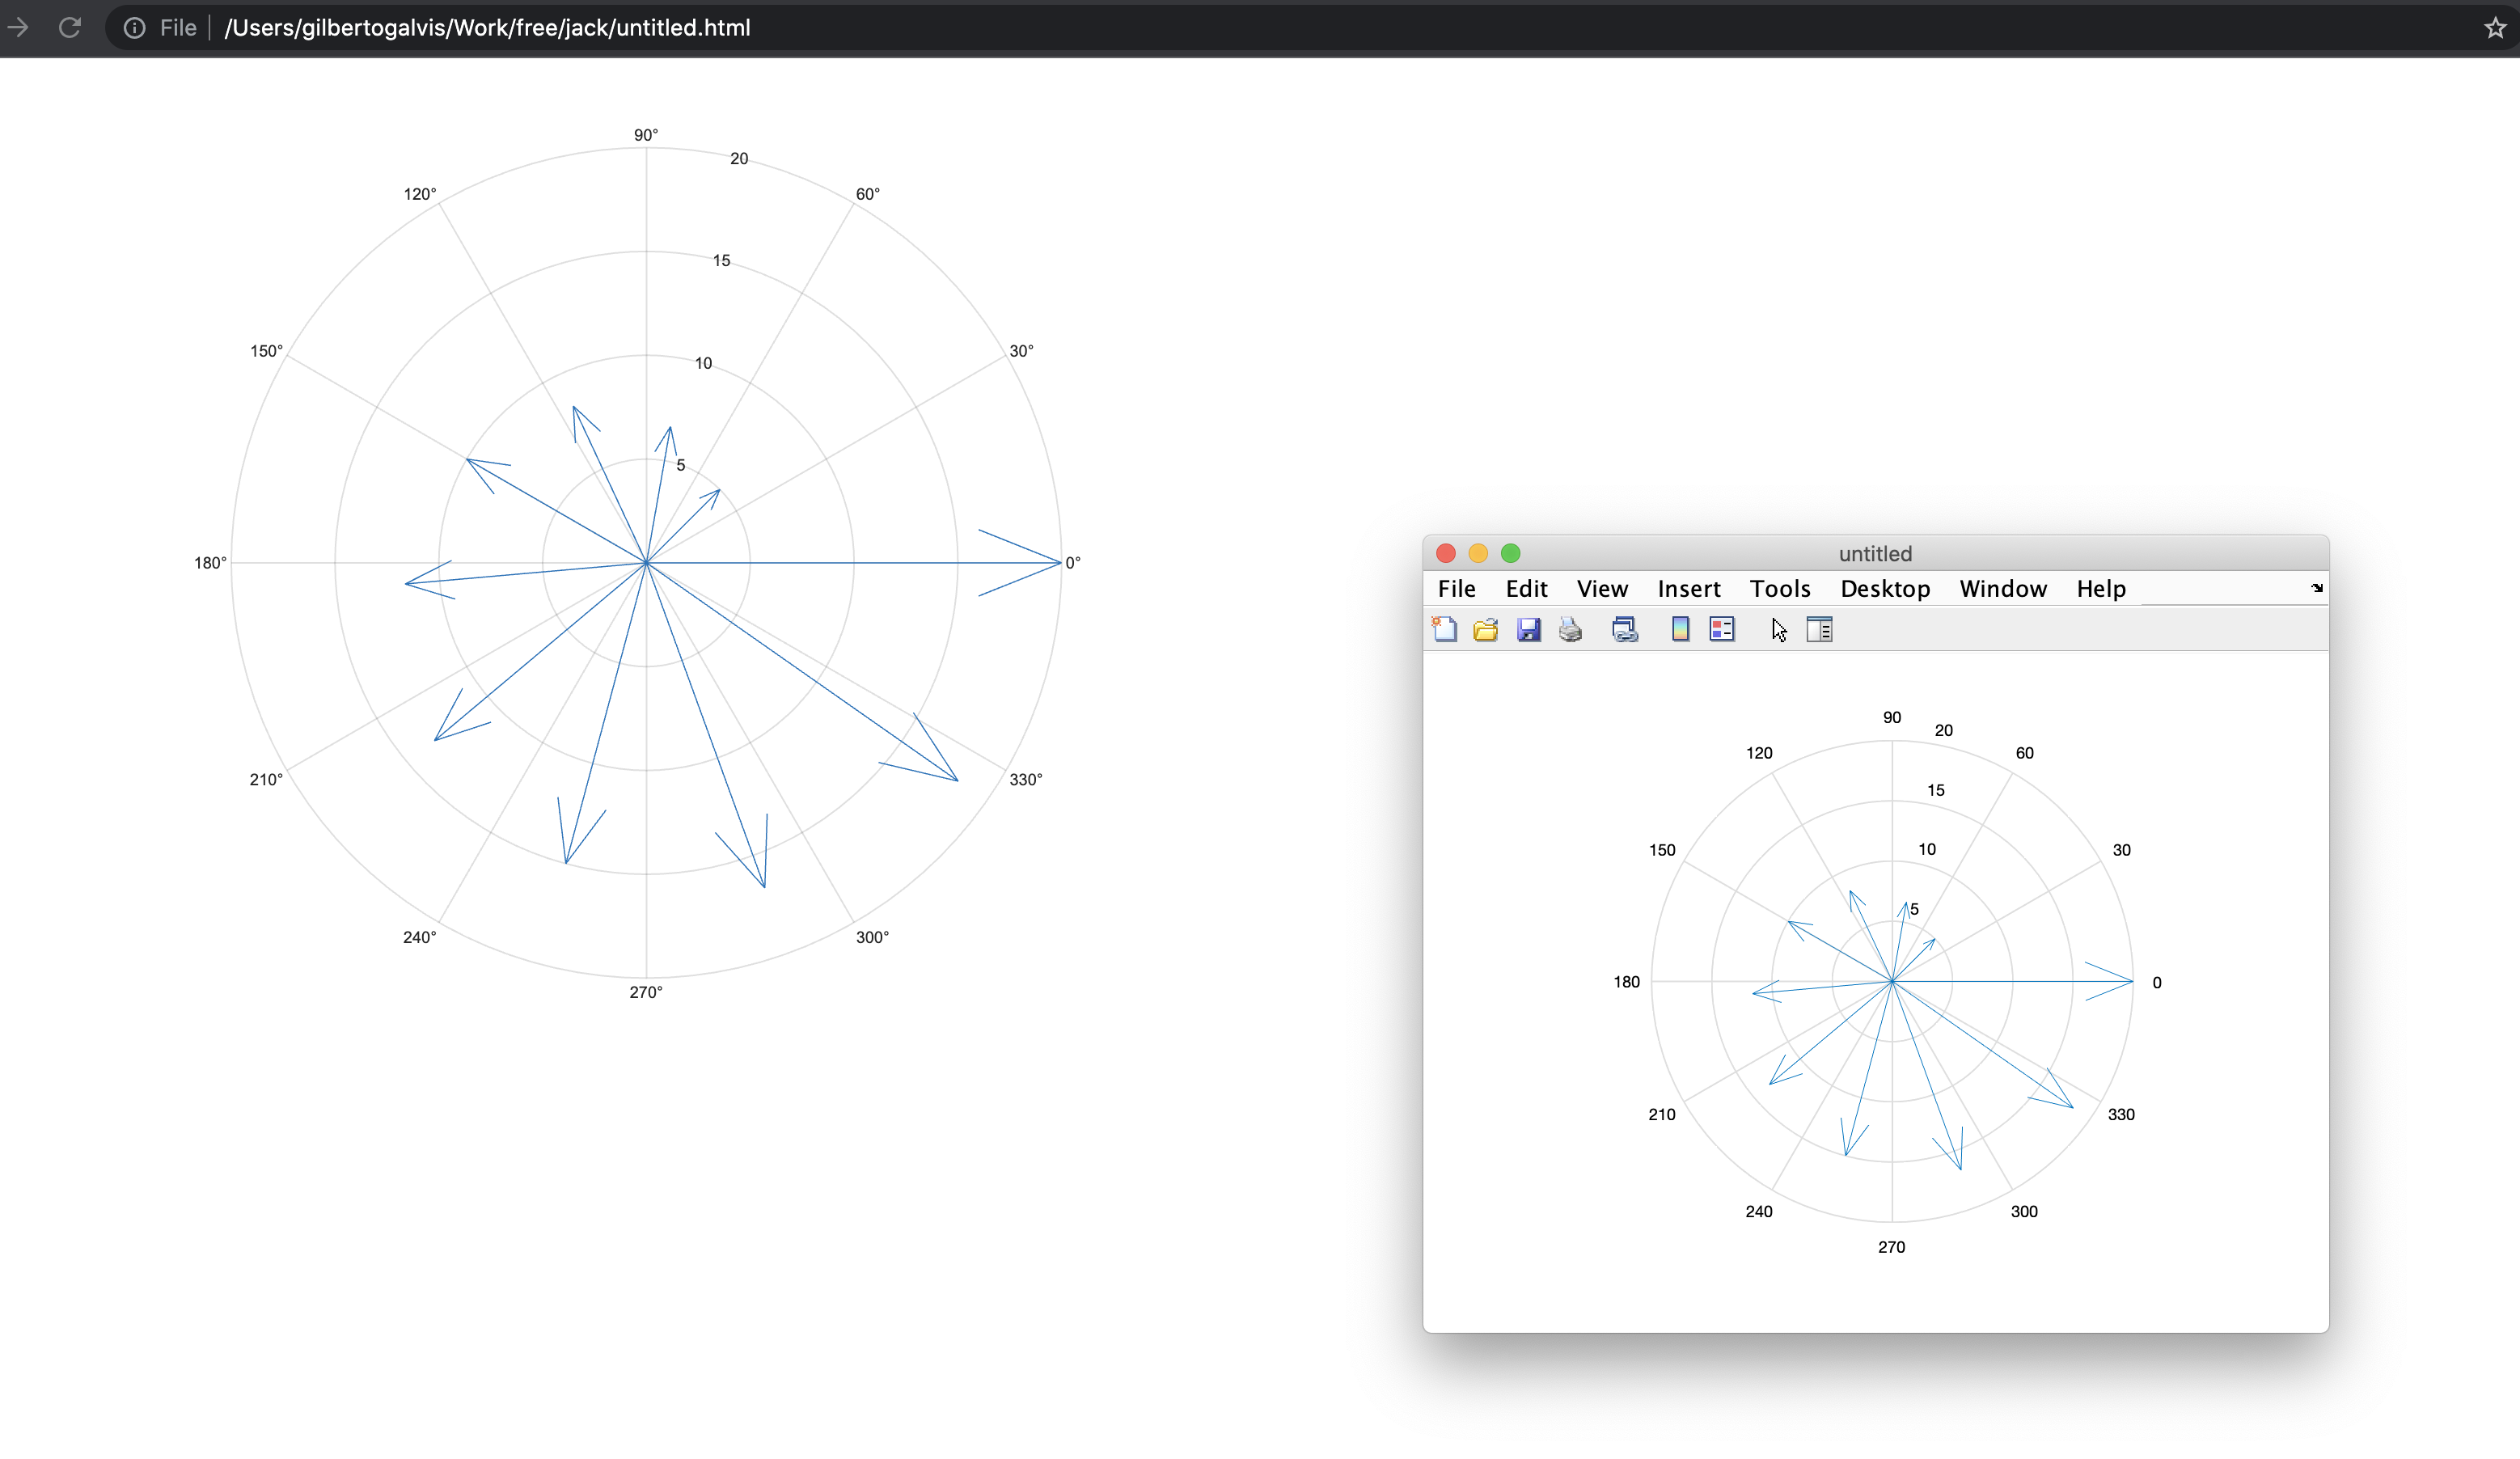
Test code 1
u = [5 3 -4 -3 5];
v = [1 5 3 -2 -6];
compass(u,v)

fig2plotly(gcf, 'TreatAs', 'compass');

Test code 2
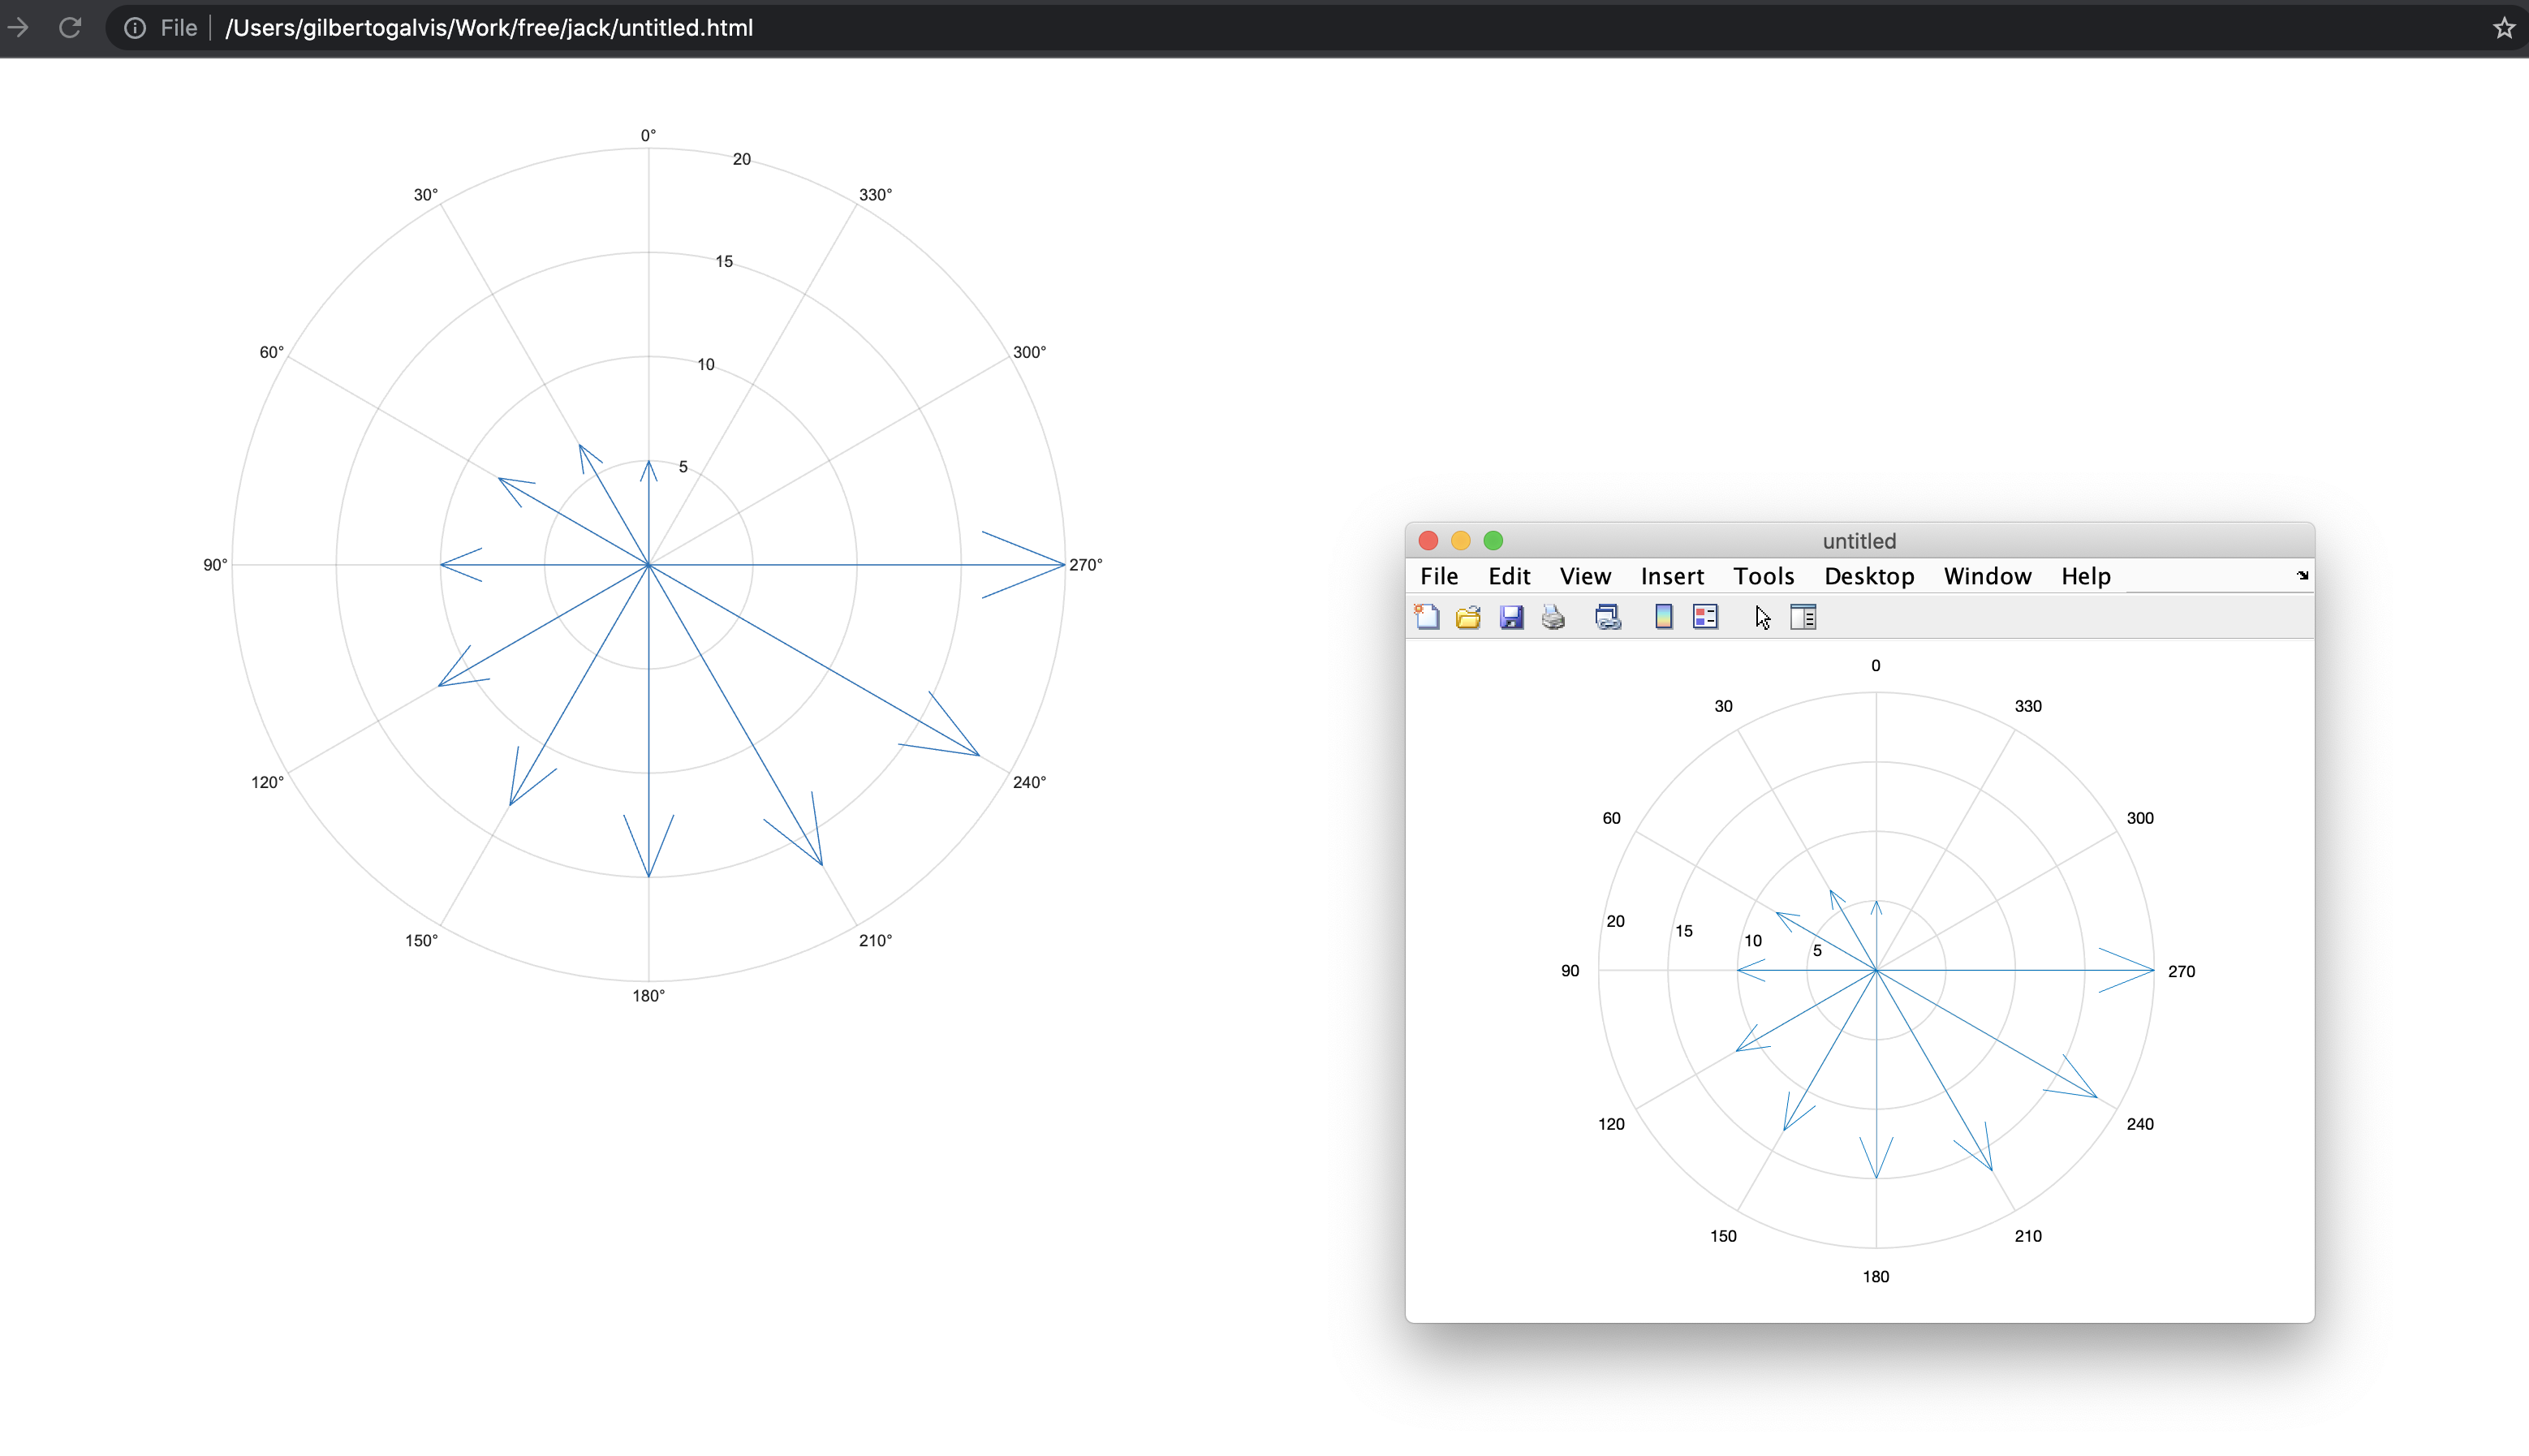
th = linspace(pi/4,2*pi,10);
r = linspace(5,20,10);
[u,v] = pol2cart(th,r);
compass(u,v)

fig2plotly(gcf, 'TreatAs', 'compass');
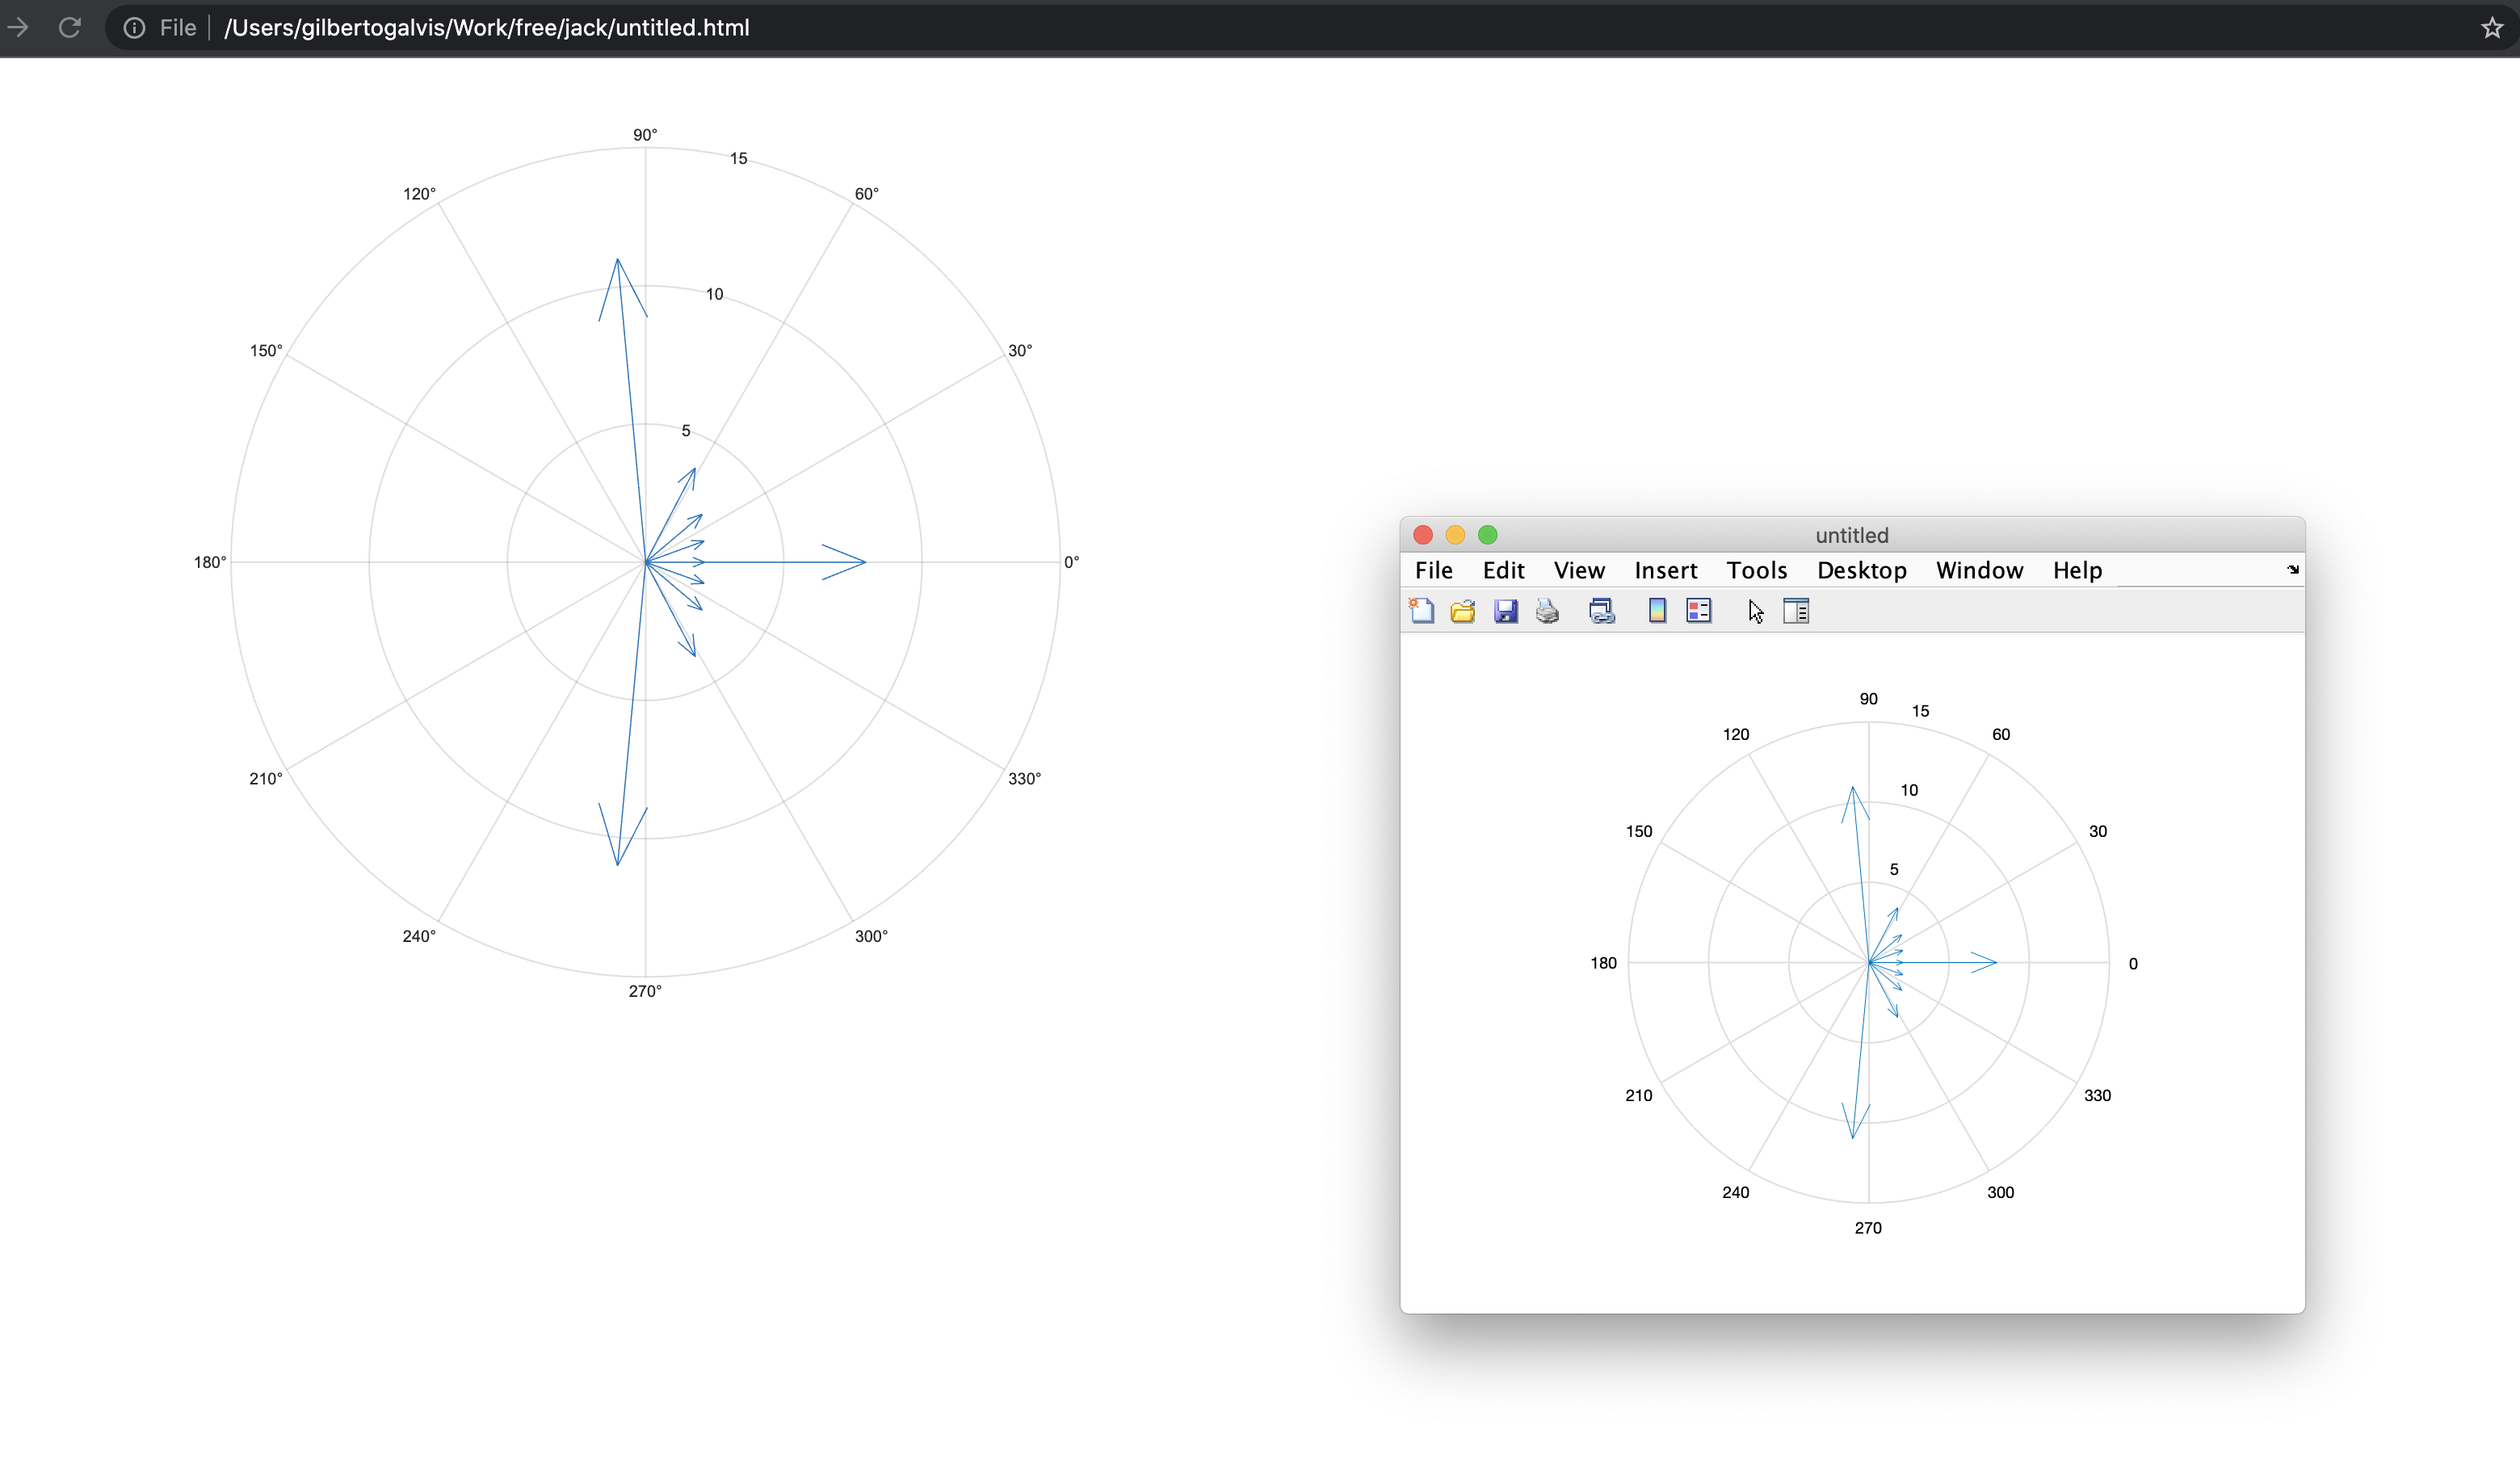
Test code 3
t = linspace(0,8*pi,100);
y = sin(2*t) + 2*sin(t+pi/2);
f = fft(y,10);

compass(f)

fig2plotly(gcf, 'TreatAs', 'compass');
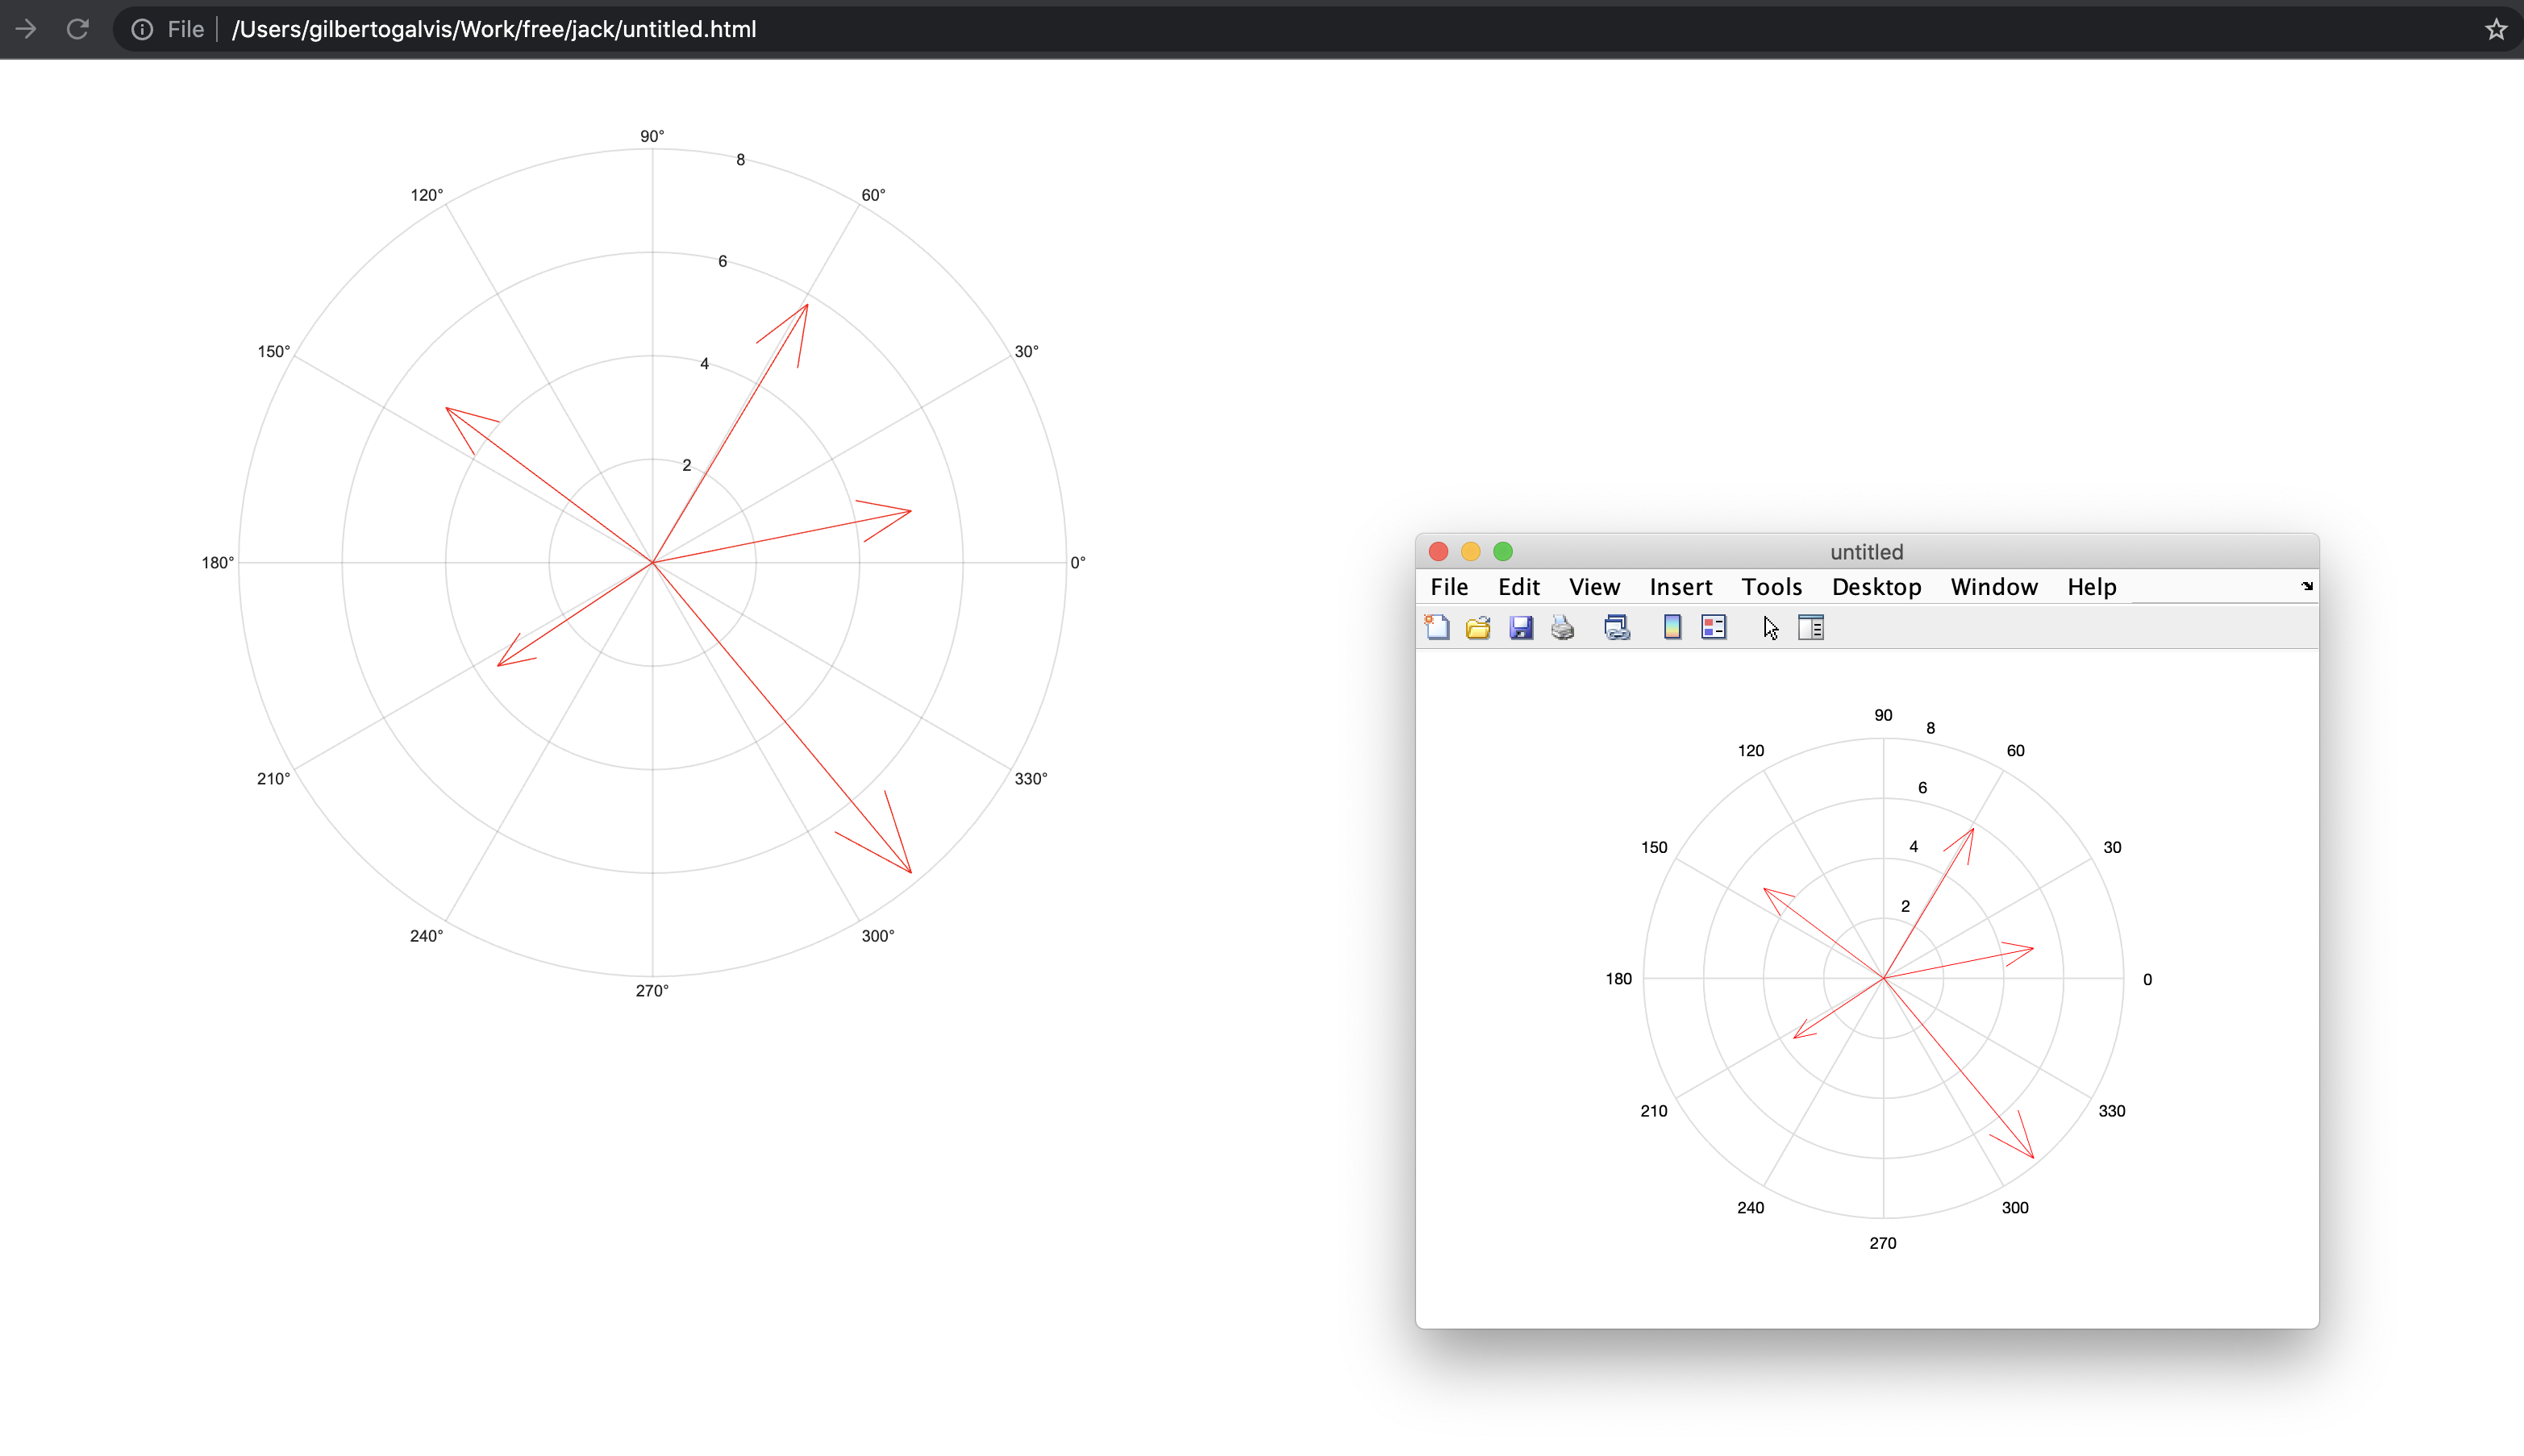
Test code 4
u = [5 3 -4 -3 5];
v = [1 5 3 -2 -6];
compass(u,v,'r')

fig2plotly(gcf, 'TreatAs', 'compass');
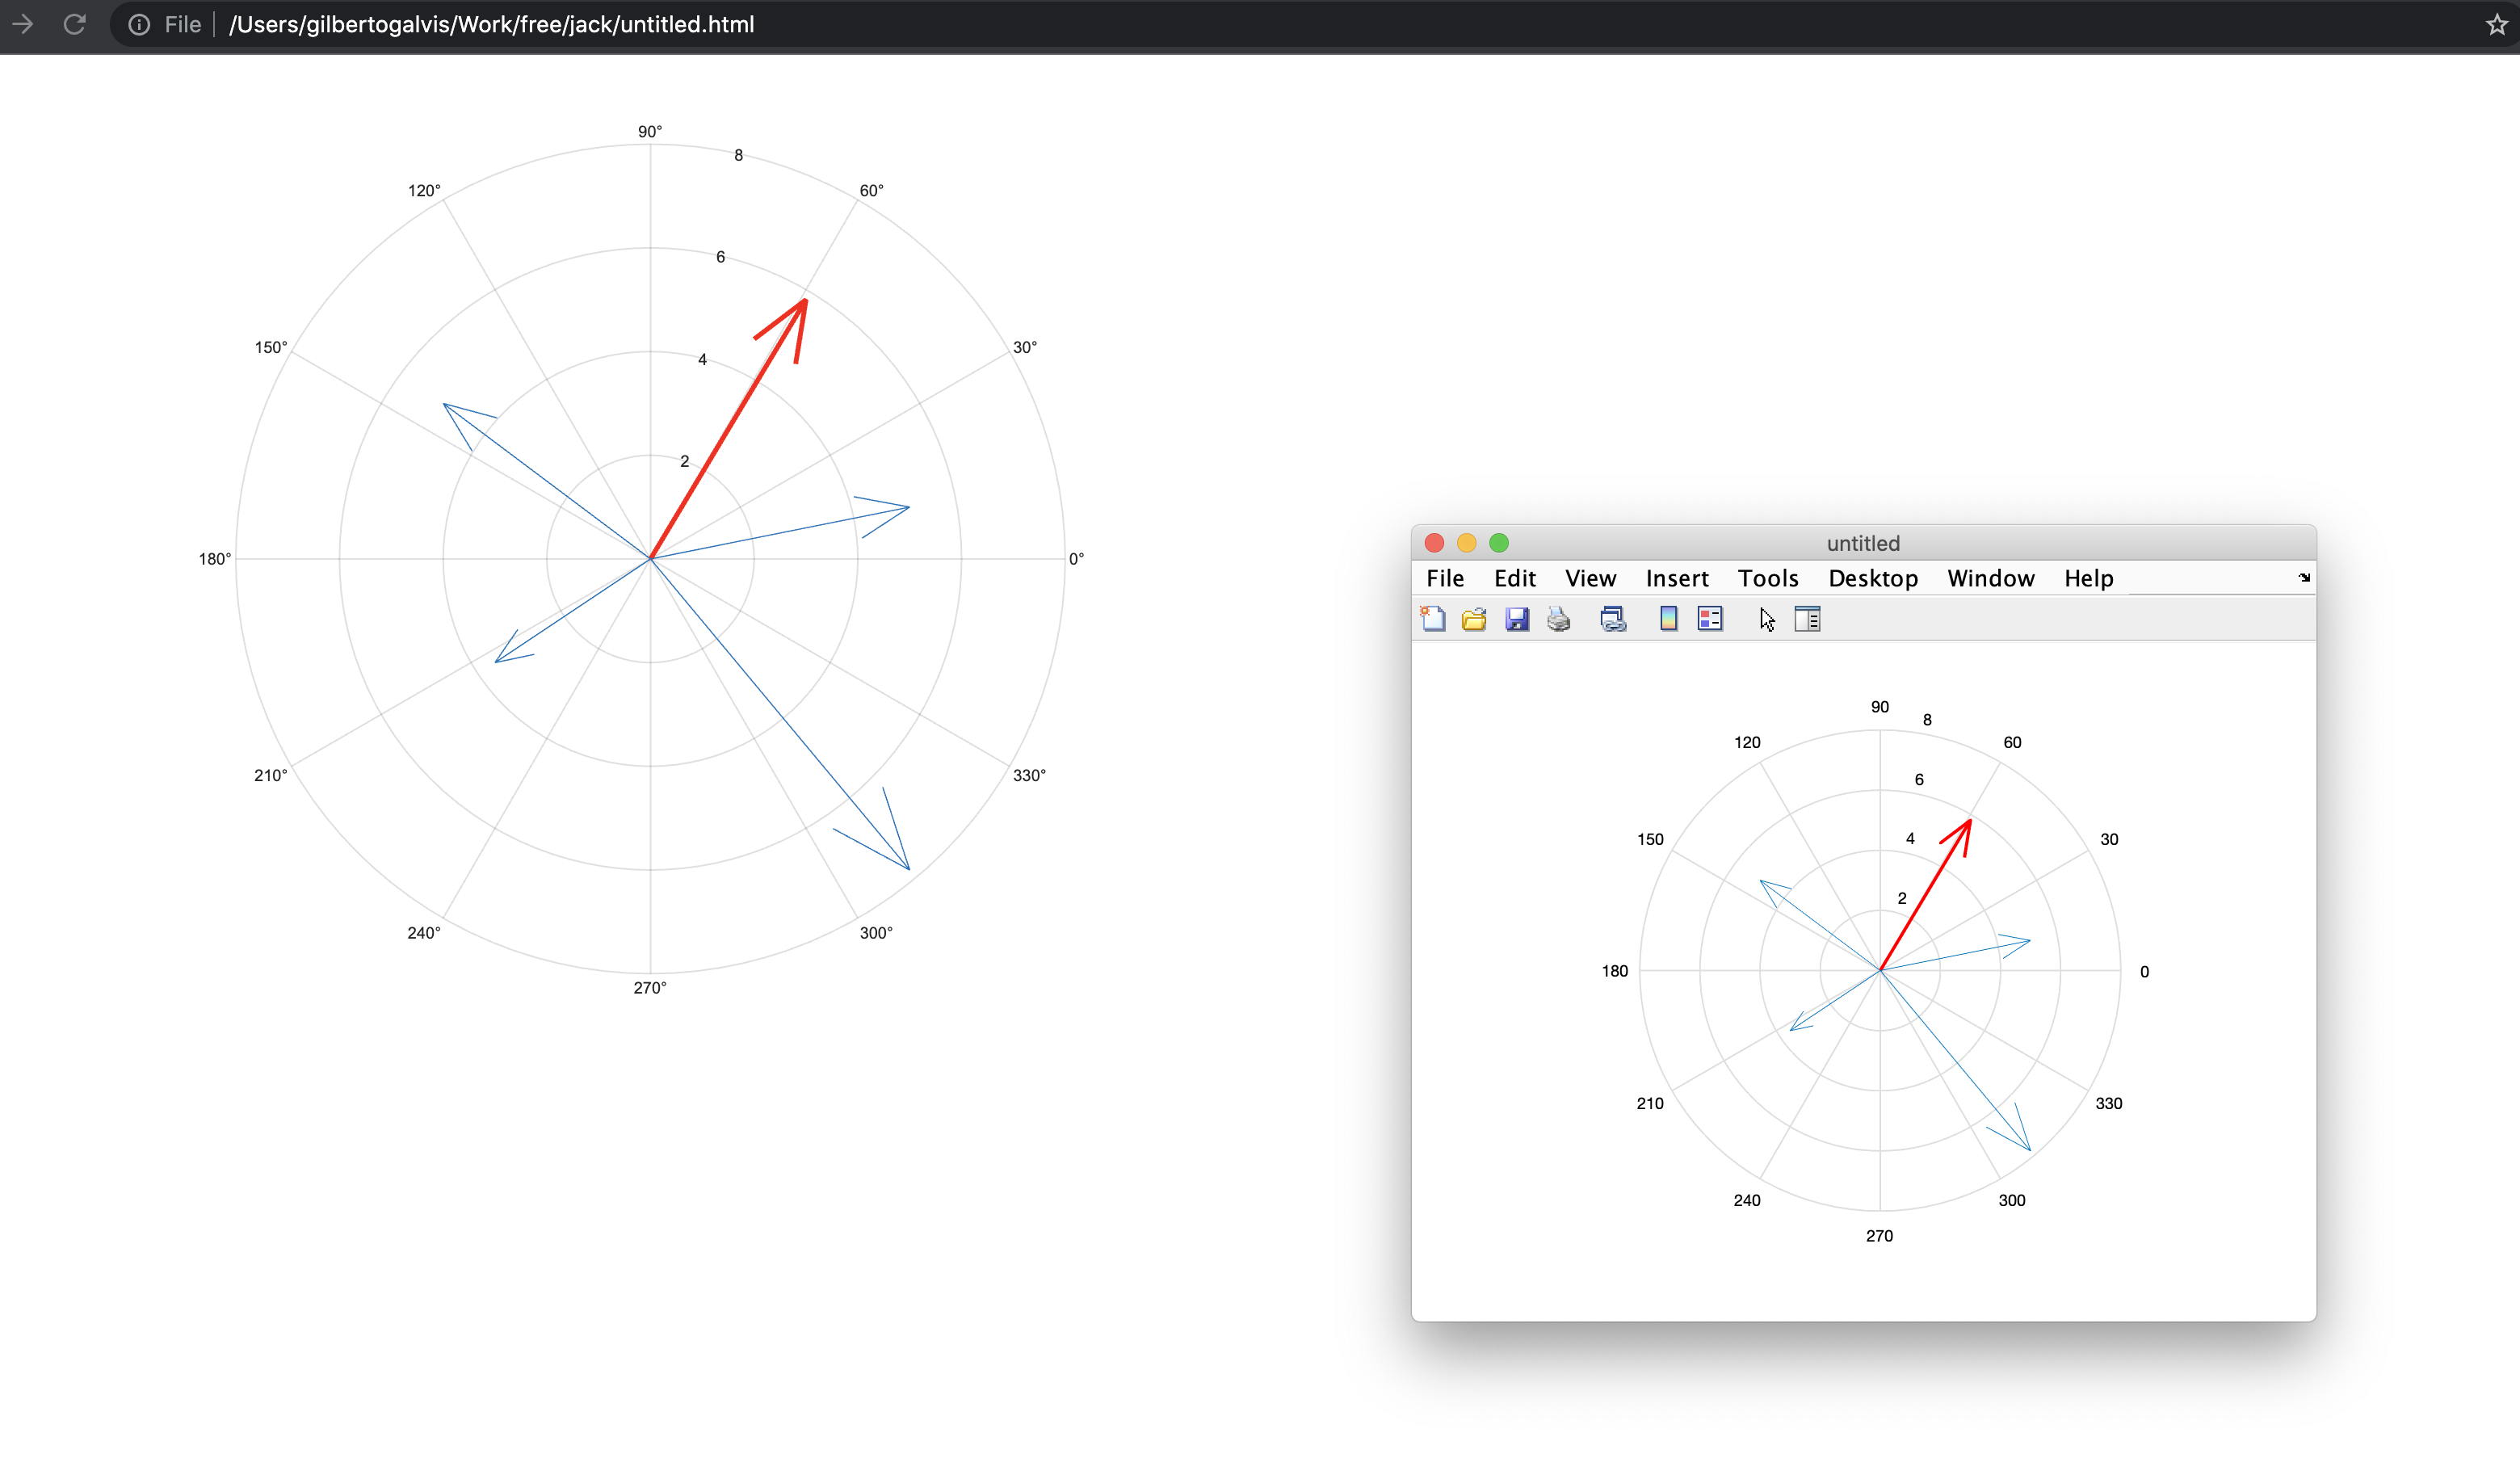
Test code 5
u = [3 5 -4 -3 5];
v = [5 1 3 -2 -6];
c = compass(u,v);

c1 = c(1);
c1.LineWidth = 2;
c1.Color = 'r';

fig2plotly(gcf, 'TreatAs', 'compass');
Test code 6
th = linspace(0,3*pi/2,10);
r = linspace(5,20,10);
[u,v] = pol2cart(th,r);
compass(u,v)

view(-90,90)

fig2plotly(gcf, 'TreatAs', 'compass');
Test code 7
u = [7 5 -2 -5 8];
tiledlayout(1,2)

% Left plot
ax1 = nexttile;
v1 = [3 7 5 -4 -6];
compass(ax1,u,v1)
title(ax1,'Left Plot')

% Right plot
ax2 = nexttile;
v2 = [-3 -4 -5 6 6];
compass(ax2,u,v2)
title(ax2,'Right Plot')

fig2plotly(gcf, 'TreatAs', 'compass');
