docs - color issues
danton267 opened this issue · 1 comments
danton267 commented
x = linspace(0,3*pi,200);
y = cos(x) + rand(1,200);
c = linspace(1,10,length(x));
scatter(x,y,[],c)

fig2plotly(gcf);
prints this error, and the resulting plot is not colored
Unrecognized function or variable 'numColor'.
We had trouble parsing the scatter object.
This trace might not render properly.
same with this:
x = linspace(0,3*pi,200);
y = cos(x) + rand(1,200);
sz = 25;
c = linspace(1,10,length(x));
scatter(x,y,sz,c,'filled')

fig2plotly(gcf);
for this one, the middle of the plot is supposed to be transparent, it is all one color
x = randn(1000,1);
y = randn(1000,1);
s = scatter(x,y,'filled');

distfromzero = sqrt(x.^2 + y.^2);
s.AlphaData = distfromzero;
s.MarkerFaceAlpha = 'flat';

fig2plotly(gcf);
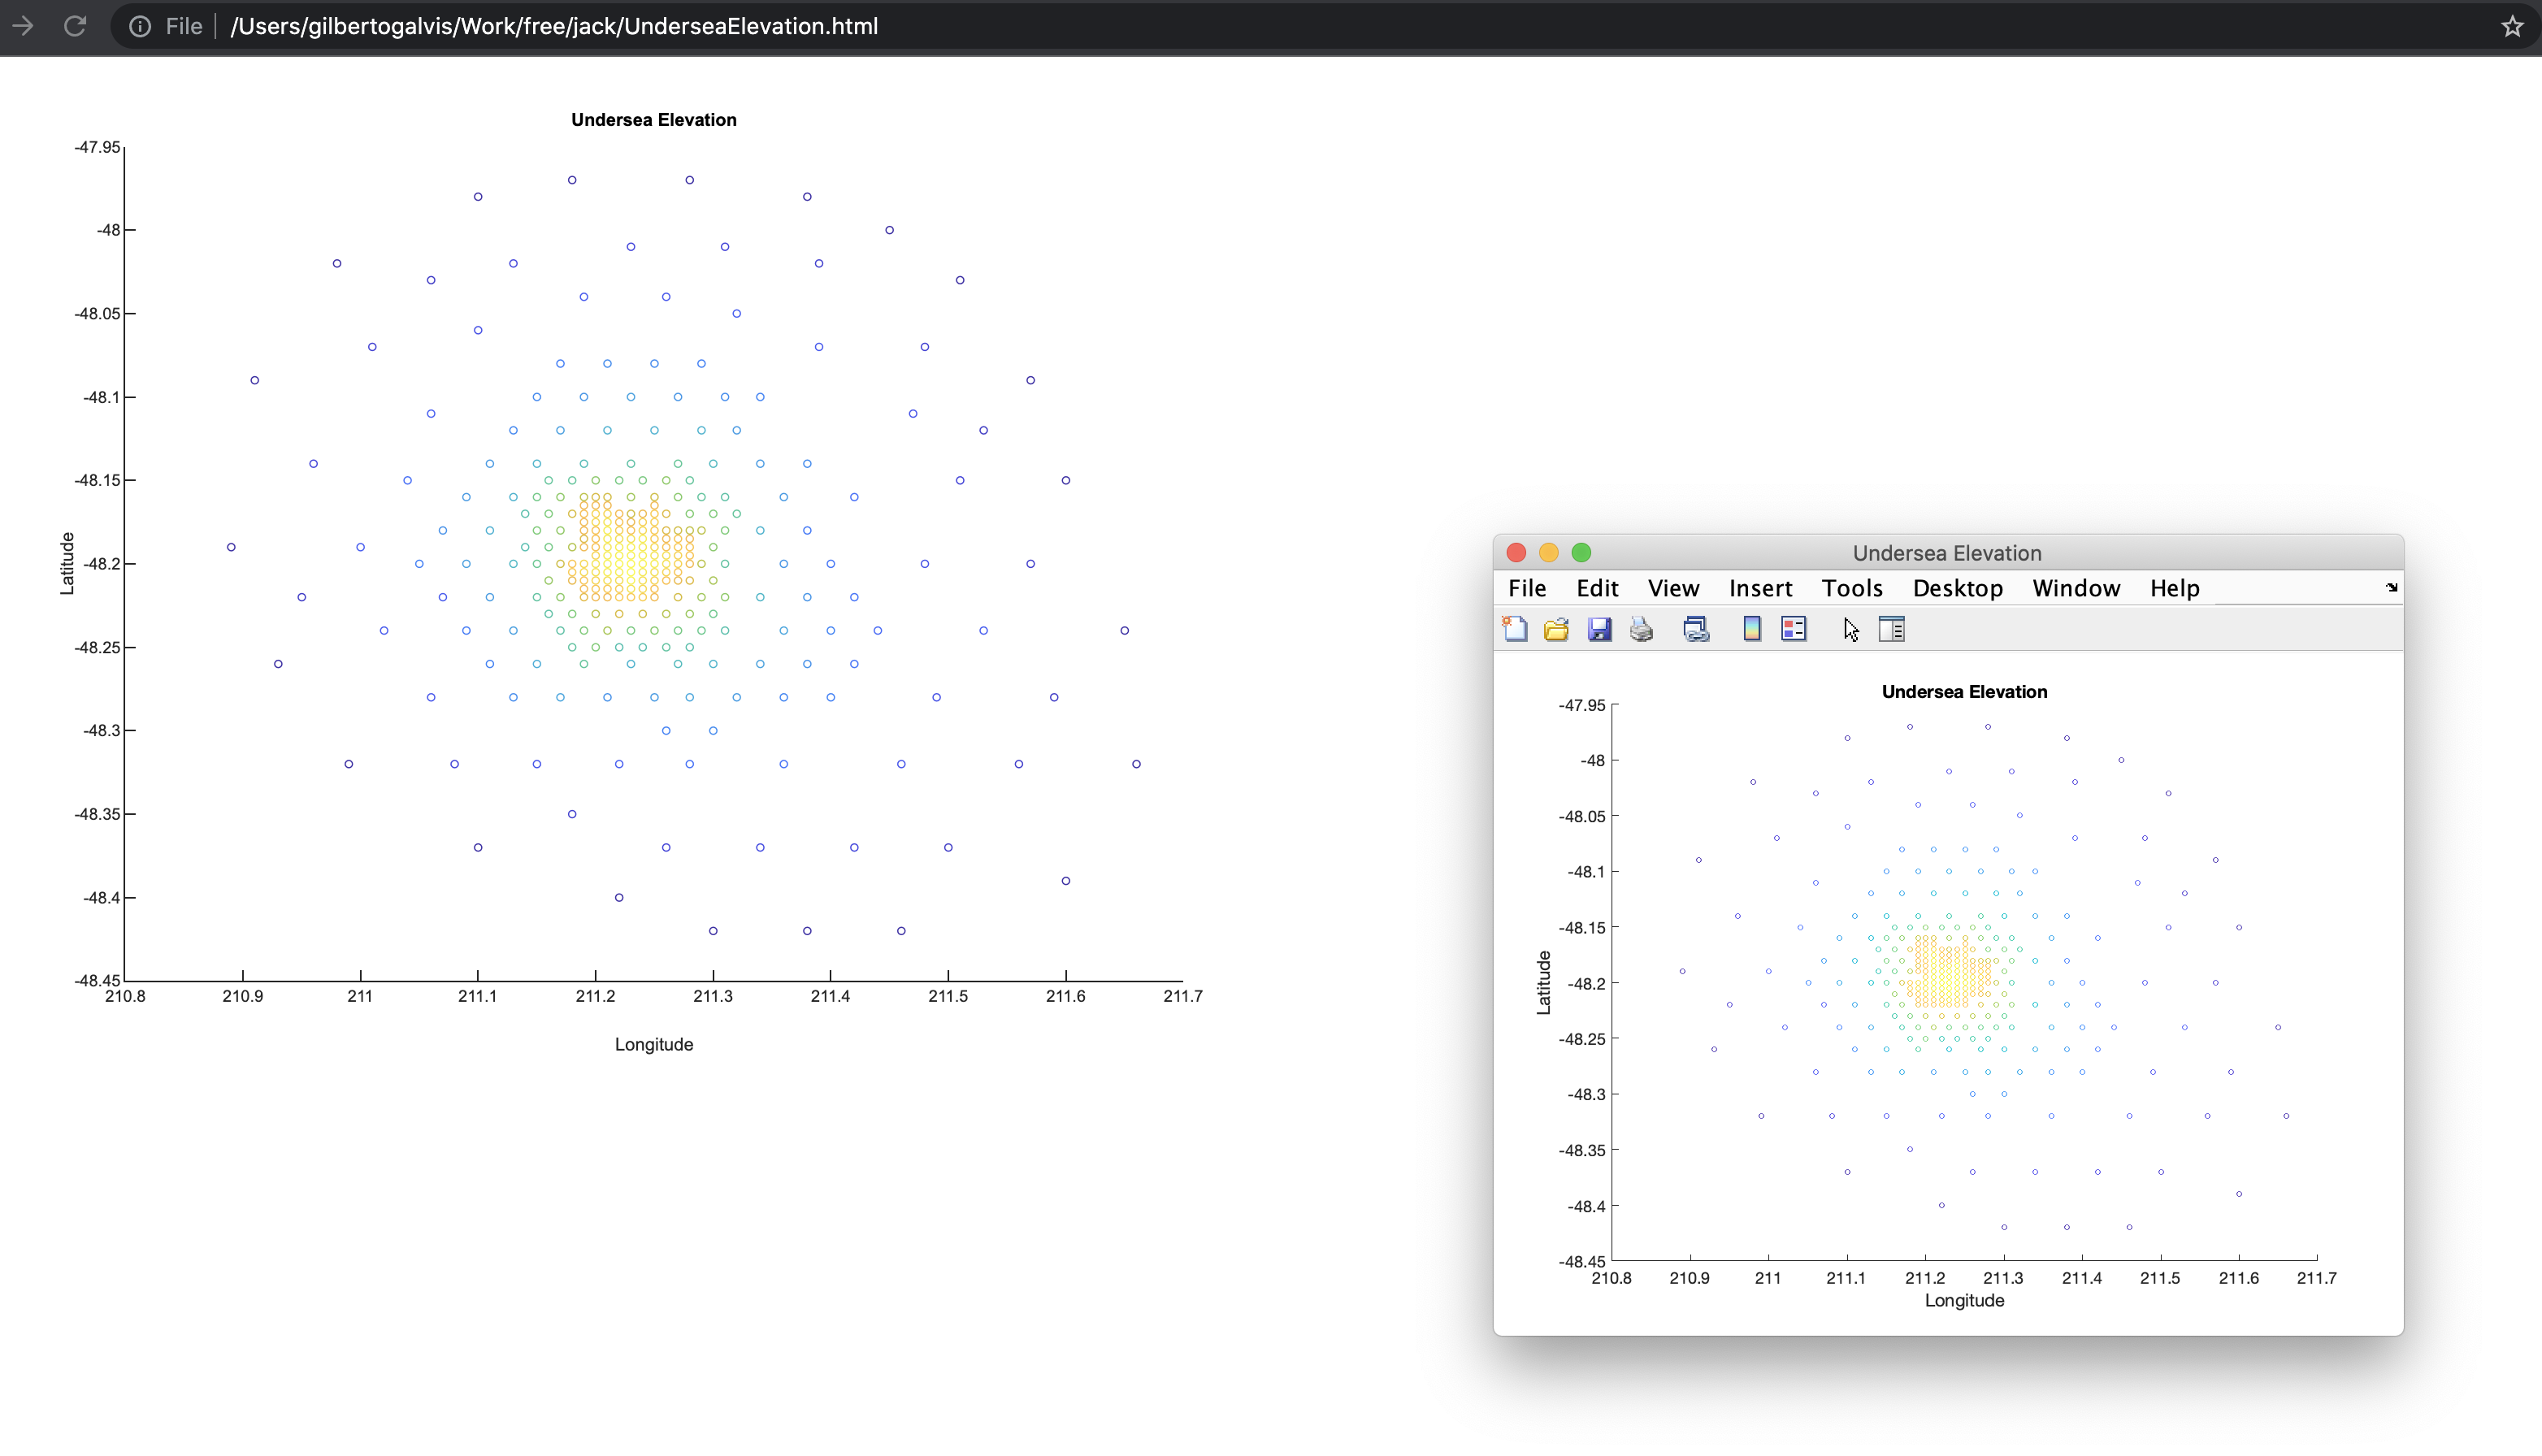
this plot when translated to plotly becomes unreadable:
load seamount x y z;

fig = figure;
scatter(x, y, 10, z);

title('Undersea Elevation');
xlabel('Longitude');
ylabel('Latitude');

fig2plotly(gcf);
gilbertogalvis commented