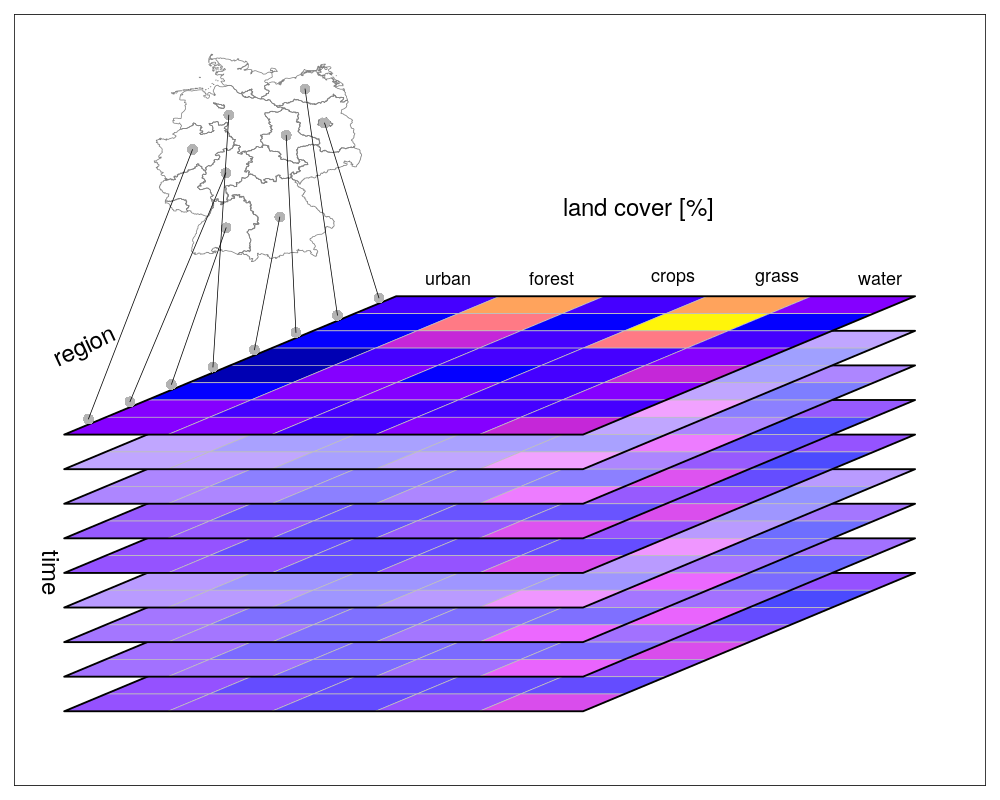
Create a spatial vector cube figure
Closed this issue · 6 comments
It would be great to create a figure similar to the one below from https://r-spatial.github.io/stars/, but using tmap.
@mtennekes do you have any idea if this can be done programmatically?
If you want the tmap route, you would have to create a sheared stars object with coordinates somewhere around the Balkan countries, and duplicate/shift it a few times.
If you go for the grid approach, there is an sf function st_as_grob that transforms an sf object to a grid grob. So Germany can be plotted in a grid viewport, and the raster layers in another viewport.
Let me know if you need help for this! I'm already quite experienced in grid graphics:-)
Agree.
What do you think of my comment in https://github.com/r-tmap/tmap-book/blob/master/code/data_model_figures.R#L231 ?
Note: data values do not correspond with reality, e.g. some provinces should have much higher values for "urban". Either we should use non-informative category labels like "A", "B", etc., or real land-use data.
Probably using real land-use data (or more or less correct data) would be perfect. I also think that it would be great to add some noise to the bottom layers (to show the change through time.
Done. I've used Eurostat landuse data. I've transitioned the data from 2009 (bottom layer) to 2015 (top layer). However and unfortunately, there is not much variation between 2009 and 2015.
It's perfect!

