Investigating social phenomena prevalent in online covid-19 discourse through network-agent based modellingAnthony Reidy |
It is good practice to develop in a virtual environment. Note, this code contained in this assignment was written using python 3.8 and on the Ubuntu (Linux) operating system (OS). As such, all commands are setup for this installation and may not work for other OS's. To create a virtual environment called venv, execute:
python3 -m venv venvTo activate it, execute
source venv/bin/activate- Execute
pip3 install -r requirements.txtto install requirements for development.
The report for this investigation can be found here.
$ python3 model.py --help
Usage: model.py [options]

Options:
  -h, --help            show this help message and exit
  -n NUM_AGENTS, --num_agents=NUM_AGENTS
                        Number of agents in network.
  -l N_NEIGHBORS, --n_neighbors=N_NEIGHBORS
                        Number of neighbors for each node
  -t NETWORK_TYPE, --network_type=NETWORK_TYPE
                        1 for small-world, 2 for scale free
  -b BETA_COMPONENT, --beta_component=BETA_COMPONENT
                        if network type is small world (1); this is the beta-
                        component
  -s SIMILARITY_TRESHOLD, --similarity_treshold=SIMILARITY_TRESHOLD
                        Range in which similarity holds
  -i SOCIAL_INFLUENCE, --social_influence=SOCIAL_INFLUENCE
                        The influence of neighboring agents on the forming of
                        a new preference.
  -w SWINGERS, --swingers=SWINGERS
                        Number of agents which switches opinion, preference,
                        and trust with each timestep.
  -v MALICIOUS, --malicious=MALICIOUS
                         Number of malicious agents
  -e ECHO_LIMIT, --echo_limit=ECHO_LIMIT
                        Limit for edge strength (weight) for echo chamber
                        calculation.
  -m ALL_MAJORITY, --all_majority=ALL_MAJORITY
                         If true: all agents except malicious agents have the
                        same opinion
  -o OPINIONS, --opinions=OPINIONS
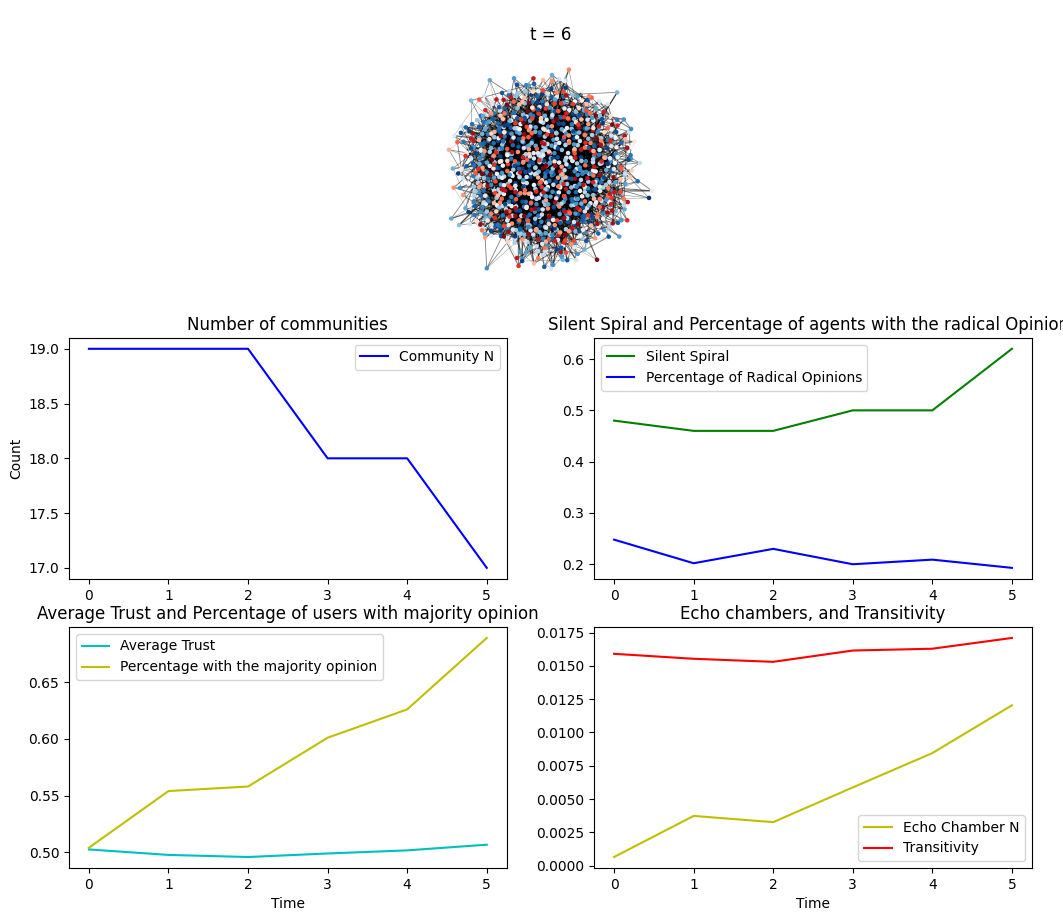
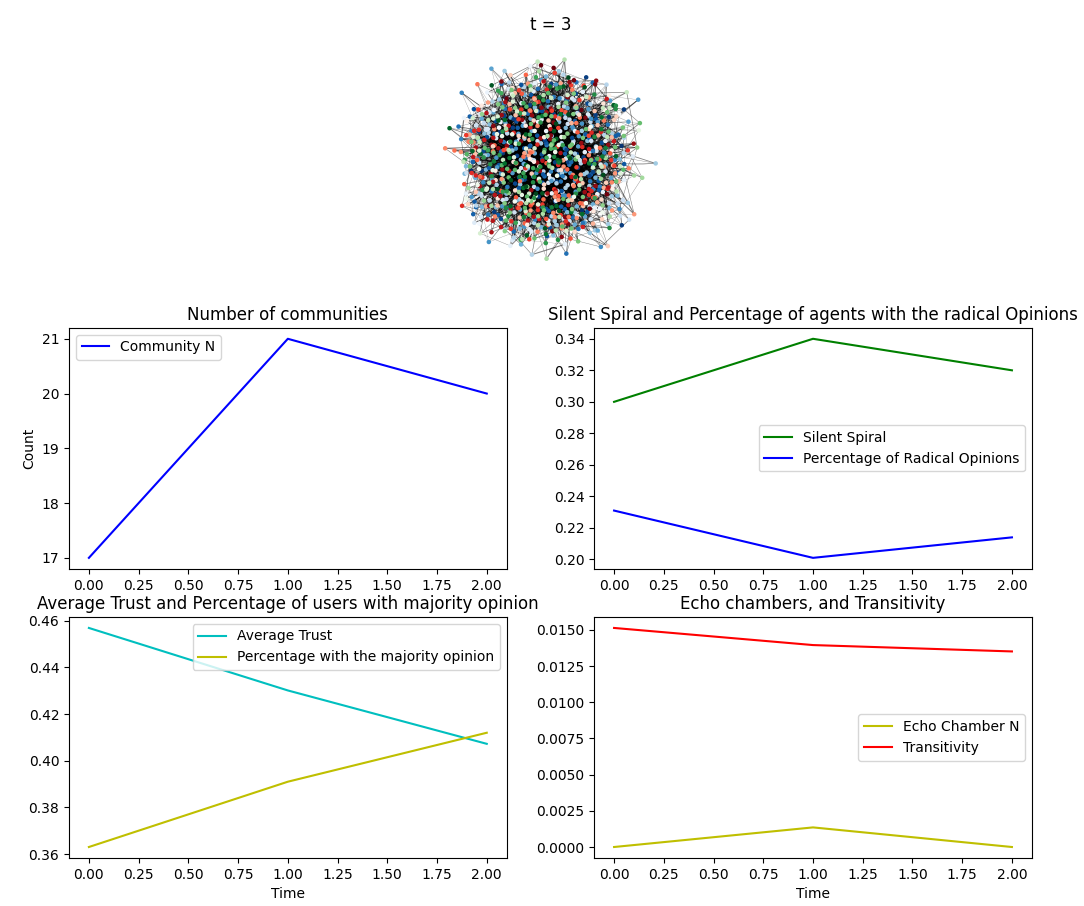
Number of opinions The graphical user interface has five main components:
- Network visualisation (upper): The upper panel displays the network. The colour of each node indicates it's opinion where as the strength of the color shade indicates its preference. The strength of the edge's grey color indicates the trust between two agents In addition, the current step is displayed.
- Number of communities (upper left): Time series graph displaying communities over time t as defined by the Louvain algorithm.
- Silent Spiral, and percentage of agents with radical opinions (upper right): Time series graph displaying the number of silent spirals, and the percentage of agents with radical opinions over time t.
- Average Trust, percentage of agents with majority opinion (bottom left): Time series graph displaying the average trust and percentage of agents with the majority opinion throughout the network.
- Echo chamber and transitivity (bottom right): Time series graph displaying Transitivity, and the percentage of echo chambers over all cliques through time t.
-
model.py A python module that contains the majority of the code related to the model. It describes the initialization strategy (random activation), the update steps and the time series graphs visualisation.
-
Analysis.py A python module that contains "compute functions" for the output parameters e.g. echo chamber count
-
Visualization.py Code required to visualize the network. I decided to put this into a separate file given the size of the code required.

