functions using riemann.folds/count drops suddenly on high load
arpitjindal97 opened this issue · 2 comments
Describe the bug
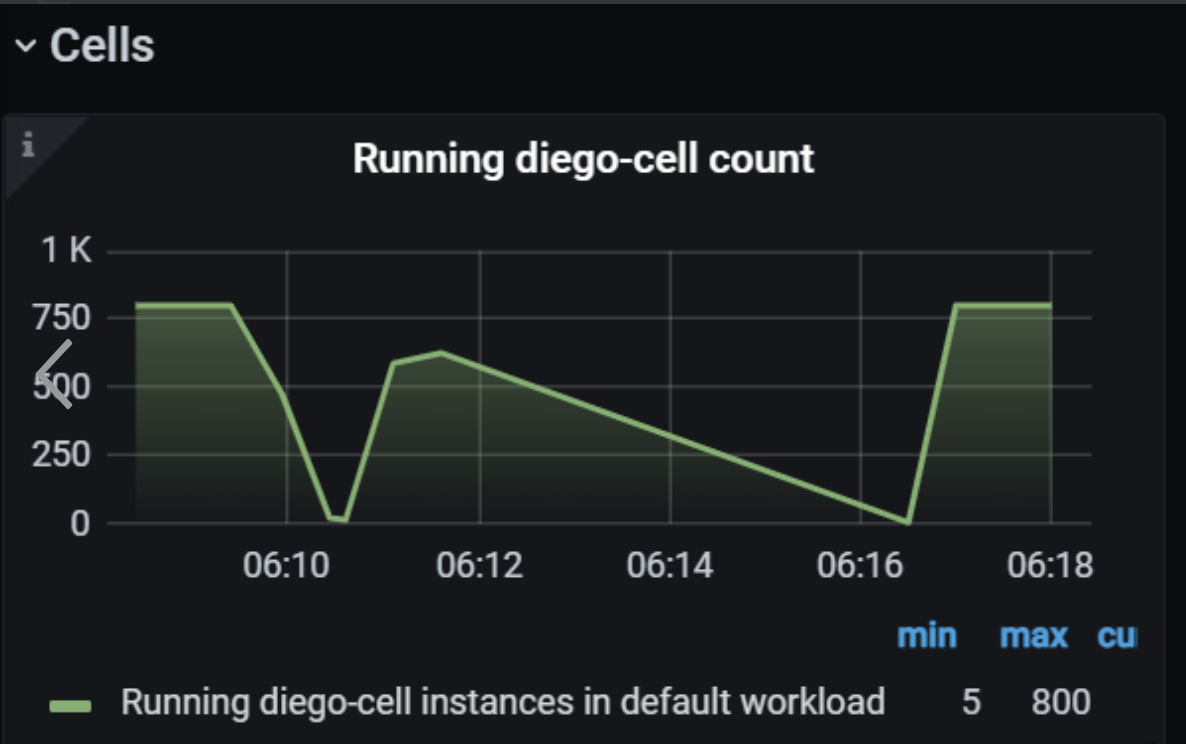
Metric value calculated by riemann.folds/count suddenly drops.
To Reproduce
We are running riemann with below clojure code.
(def cc-worker-nodes-count
  "count number of vm nodes based bosh metrics"
  (let [reinject (tap :some_count reinject)]
    (where (service #"^System\..+\.system_memory_perc$")
           (with :ttl 60
                 (coalesce 30
                           (smap riemann.folds/count
                                 (with {:host nil :service "System.some_count" :ttl nil :state nil}
              ; set current time for new event (the events that coalesce holds may contain different timestamps which is confusing in the unit-tests)
                                       (smap (fn [event]
                                               (assoc event :time (long (round (unix-time)))))
                                             reinject))))))))
When a high frequency of metrics System.system_memory_perc is sent concurrently to riemann, the calculated metric System.some_count dips (almost zero). When the load is reduced, the metric count comes back to the normal expected value.
Expected behavior
The metric count should not drop
Screenshots
This line should not drop during heavy load.
Background (please complete the following information):
- OS: Linux
- Java/JVM version 8
- Riemann version 0.3.1
Additional context
Could there be an issue with riemann.folds/count function being buggy because we are witnessing drops on panel wherever this particular function is used. In the latest version of riemann also, the source code of this function remains the same as it was in 0.3.1.
What is the frequency/ttl of the events you send to Riemann ?
EDIT: your TTL is 60, I missed the with :ttl :D
I don't think there is an issue with folds/count, because it will just count (using clojure.core/count) number of events passed from coalesce. Try to see how coalesce behaves by passing down events with different ttl. A bit chatty example, but will show you what coalesce collects:
 (where (service #"^System\..+\.system_memory_perc$")
   (with :ttl 60
     #(clojure.tools.logging/info "pre=> " %)
     (coalesce 30
       #(clojure.tools.logging/info "after=> " (count %) ": " %))))
in that after=> line, you should see a list of events coalesce figured out that needed to be passed down the stream and the total number of them. If you get zero, check if events got expired somehow, as coalesce will remove them from the list.