- ST0263, Project 2
Students:
- Sebastian Pulido Gomez, spulido1@eafit.edu.co
- Danilo De Jesus Toro Echeverri, djtoroe@eafit.edu.co

Professor:
- Edwin Nelson Montoya Munera, emontoya@eafit.edu.co
Our autoscaling implementation has the following accomplishments:
- A system with a monitor server.
- A system with a monitor client.
- A monitor server that receives metrics from monitor clients via gRPC.
- A monitor client that sends metrics to monitor server via gRPC.
- A monitor client that simulates metrics via a poison distribution.
- A monitor server that can create EC2 instances equipped with a monitor client and a configuration file.
- A monitor server that can send ICMP PING requests to launched instances to check their presence.
- A monitor server that can relaunch dead instances if necessary.
- A monitor server that can scale instances up or down depending on policies such as http-load or cpu-load.
- A monitor server with multiple configurable parameters via a config file.
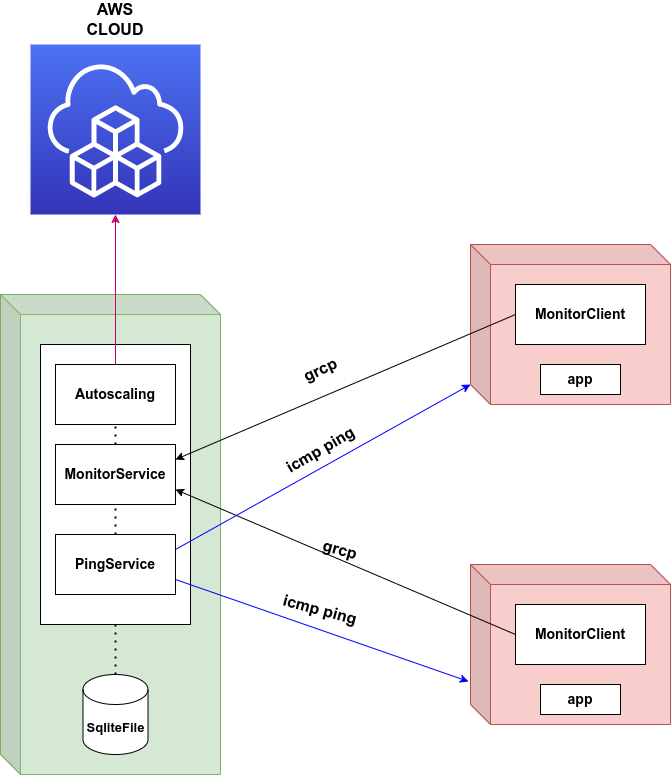
This diagram depicts three main components in our system:
- Monitor service (green box): It's main function is to receive metrics from monitor clients which are used to determine whether the service should be scaled up (running more instances) or down (terminating some instances). Metrics are received via gRPC and storage in a Sqlite file where each one of the created instances is associated with a record of metrics. The monitor service also dispatches ICMP PING requests to determine whether an instance is alive or not. The timeout, count and frequency of PINGs is configurable. If an instance is determined to be dead, a new one will be relaunched only if the current count is less than the minimum quota specified in the configuration. Finally, the AWS module in the monitor server is capable of launching the new instance together with a script that is lunched when the instance is booted. This way, every instance is initialized with a proper configuration file that has all of the necessary information for the client monitor to reach the server.
- Monitor client (red box): It's only function is to send metric to the monitor server via gRPC. There are two types of metrics, namely, http-load and cpu-load and both range from 0 to 100. Both types of metrics are simulated via a Poisson distrbution in order to prevent abrupt changes.
- AWS cloud (blue box): It's the cloud where our autoscaling system operates. The monitor server is capable of running and terminating instances via the AWS API and proper credentials that are provided in the configuration file.
This lab project was developed and tested in Ubuntu 22.04.
Monitor service
The monitor service was implemented with the Haskell programming language with compiler ghc-8.10.7.
All of the dependencies together with their versions are specified in the package.yaml file
in the hsAutoscaling subproject.
Monitor client
The monitor client was implemented with the Haskell programming language with compiler ghc-8.10.7.
All of the dependencies together with their versions are specified in the package.yaml file
in the hsMonitor subproject.
hscaling
├── build-release.sh
├── first-time-install.sh
├── hsAutoscaling
│   ├── app
│   │   └── Main.hs
│   ├── asg-config.yaml
│   ├── CHANGELOG.md
│   ├── db
│   │   ├── create-db.sh
│   │   └── schema.sqlite
│   ├── gen-buffs.sh
│   ├── hsAutoscaling.cabal
│   ├── LICENSE
│   ├── package.yaml
│   ├── README.md
│   ├── Setup.hs
│   ├── src
│   │   ├── AutoScalingGroup
│   │   │   ├── App.hs
│   │   │   ├── AWS.hs
│   │   │   ├── CRUD.hs
│   │   │   ├── Env.hs
│   │   │   ├── Ping.hs
│   │   │   └── Scaling.hs
│   │   └── Grpc
│   │       ├── Protobuf
│   │       │   └── Monitor.hs
│   │       └── Server.hs
│   ├── stack.yaml
│   ├── stack.yaml.lock
│   └── test
│       └── Spec.hs
├── hsMonitor
│   ├── app
│   │   └── Main.hs
│   ├── CHANGELOG.md
│   ├── gen-buffs.sh
│   ├── hsMonitor.cabal
│   ├── LICENSE
│   ├── package.yaml
│   ├── README.md
│   ├── Setup.hs
│   ├── src
│   │   ├── Env.hs
│   │   ├── Grpc
│   │   │   ├── Client.hs
│   │   │   └── Protobuf
│   │   │       └── Monitor.hs
│   │   └── MetricGen.hs
│   ├── stack.yaml
│   ├── stack.yaml.lock
│   └── test
│       └── Spec.hs
├── protos
│   └── grpc
│       └── protobuf
│           └── monitor.proto
├── README.md
└── style.sh
To install the dependencies necessary to build and work on this project execute the first-time-install.sh script at the root of this repository:
./first-time-install.sh
To create an sqlite database compatible with this project, run the hsAutoscaling/db/create-db.sh
script at hsAutoscaling/db. The script receives the name of the file:
cd hsAutoscaling/db
./create-db.sh monitor.db
hsAutoscaling is the project where the monitor service and autoscaling group is implemented. All of its dependencies
are managed with the cargo tool already installed with first-time-install.sh.
To build the project run
cd hsAutoscaling
stack build
To run the project:
stack run -- -c asg-config.yaml
where asg-config.yaml is an example configuration file for development which you can modify as needed:
grpcHost: 127.0.0.1
grpcPort: 50051
minInstances: 2
maxInstances: 5
balancingFrequencySecs: 20
dbPath: ./db/test-monitor.db
httpMaxLoadPercentage: 70
cpuMaxLoadPercentage: 70
monitorOpts:
  asgServerHost: 127.0.0.1
  asgServerPort: 50051
  samplingLambda: 5.5
  pushFrequencySecs: 10
pingOpts:
  responseTimeoutSecs: 3
  responseCount: 3
  pingFrequencySecs: 2
  pingIgnoreSpanSecs: 120
awsOpts:
  awsRegion: us-east-1
  accessKey: xxxx
  secretKey: xxxx
  sessionToken: xxxx
  ec2Opts:
    amiId: ami-0557a15b87f6559cf
    securityGroups:
    - "sg-02b81e14efea62542"
    - "sg-060f019b80316c35a"
    - "sg-09d74eb949ad0da22"
    instanceType: T2_Small
    namePrefix: gobbledygook
    keypair: vockey
    subnetId: subnet-05c67d31dd4cfee18
logLevel: Info
where,
grpcHost: The IP address or hostname where the gRPC server is running.grpcPort: The port number on which the gRPC server is listening. Here, it is set to50051.minInstances: The minimum number of instances that should be running in the autoscaling service. It is set to2, meaning that there should always be at least one instance running.maxInstances: The maximum number of instances that the autoscaling service can scale up to. It is set to5, meaning that the service will not create more than five instances.balancingFrequencySecs: The interval in seconds at which the autoscaling service checks instances for scaling. It is set to20, indicating that load balancing will be performed every 20 seconds.dbPath: The SQLITE file path where the autoscaling service's test-monitor database is locatedhttpMaxLoadPercentage: The maximum load percentage threshold for HTTP-based metrics. If the load exceeds this threshold, it may trigger autoscaling actions. Here, it is set to70.cpuMaxLoadPercentage: The maximum load percentage threshold for CPU-based metrics. If the CPU load exceeds this threshold, it may trigger autoscaling actions. It is also set to70.monitorOpts: Additional options for the client's monitoring functionality. It includes the following sub-fields:asgServerHost: The IP address or hostname of the autoscaling server. In this case, it is set to127.0.0.1.asgServerPort: The port number on which the autoscaling server is listening. Here, it is set to50051.samplingLambda: A lambda value used for simulating the metrics on the client side. It is set to5.5.pushFrequencySecs: The frequency in seconds at which monitoring data is pushed to the autoscaling server. It is set to10.
pingOpts: Options related to pinging functionality for health checks. It includes the following sub-fields:responseTimeoutSecs: The maximum time in seconds to wait for a response from a health check ping. It is set to3.responseCount: The number of consecutive successful responses required to consider an instance healthy. It is set to3.pingFrequencySecs: The interval in seconds at which health check pings are sent. It is set to2.pingIgnoreSpanSecs: A span of time in seconds during which health check pings are ignored. It is set to120.
awsOpts: Options related to Amazon Web Services (AWS) functionality. It includes the following sub-fields:
awsRegion: The AWS region where the autoscaling service operates. Here, it is set tous-east-1.accessKey: The access key used for authenticating with AWS services.secretKey: The secret key associated with the access key for authentication.sessionToken: An optional session token for temporary credentials.ec2Opts: Additional options for the EC2 instances created by the autoscaling service. It includes the following sub-fields:amiId: The ID of the Amazon Machine Image (AMI) used for launching EC2 instances. Here, it is set toami-0557a15b87f6559cf.securityGroups: A list of security group IDs associated with the EC2 instances. Here, it includes three security group IDs.instanceType: The type of EC2 instance to launch. In this case, it is set toT2_Small.namePrefix: A prefix used for the name of the EC2 instances created by the autoscaling service. It is set togobbledygook.keypair: The name of the key pair used for SSH authentication to the EC2 instances. Here, it is set tovockey.subnetId: The ID of the subnet where the EC2 instances are launched. It is set tosubnet-05c67d31dd4cfee18.
logLevel: The log level for the autoscaling service. It is set toDebug, indicating that detailed debug logs will be generated.
At the root of this repository there is a file named hscaling/protos/grpc/protobuf where the gRPC communication protocol has been defined. There is only one remote call procedure:
syntax = "proto3";
package monitor;

service MonitorService {
  rpc PushMetrics (PushMetricsRequest) returns (PushMetricsOkResponse) {}
}

message PushMetricsRequest {
  float cpu_load = 1;
  float http_load = 2;
  string private_dns_name = 3;
}
The protobuf file defines a monitoring service with a single method called "PushMetrics". The method expects a request message of type "PushMetricsRequest" containing information about CPU load, HTTP load, and a private DNS name. The response message type, "PushMetricsOkResponse", is not defined in the provided protobuf file.
This file is compiled with the gen-buff.sh script that uses the proto3-suite Haskell library.
The monitor client implements gRPC endpoints for the proto-file explained above at src/Grpc/Client. On the other hand, it uses a Poisson distribution to simulate both the http and cpu loads at src/MetricGen.hs. Finally, it's entrypoint is just a function that continuously samples the Poisson distribution and send them to the monitor server via gRPC.
Let's notice that the monitor client assumes that its configuration file is at /opt/monitor_config.json: src/Env.hs. That is because the monitor server produces a launch script that is executed when a monitor instance is initialized.
this configuration file looks like the following:
{"samplingLambda":9,"pushFrequencySecs":15,"asgServerHost":"172.31.90.116","asgServerPort":50051}
where,
-
samplingLambda: It's value that sets the average cases for out Poisson distribution. -
pushFrequencySecs: The It represents the frequency in seconds at which the monitor client sends metrics to the autoscaling server. -
asgServerHost: It represents the hostname or IP address of the autoscaling server that the monitor client interacts with. -
"asgServerPort: It represents the port of the autoscaling server that the monitor client interacts with.
The monitor service has five main modules, namely, Grcp/Server.hs, src/AutoScalingGroup/AWS.hs, src/AutoScalingGroup/CRUD.hs,
src/AutoScalingGroup/Ping.hs, and src/AutoScalingGroup/Scaling.hs.
Grcp/Server.hs
It's basically the implementation of the gRPC server
for the protocol buffer described in section 3.5.1.
src/AutoScalingGroup/AWS.hs
The AWS.hs module implements
the two functions that interact with the AWS cloud, namely, runInstance and terminateInstance. These functions were
implemented with the amazonka-ec2 Haskell SDK. runInstance receives
all of the parameters to create the instance--namely, instance type, image id, security groups, etc.--and dispatches a
request to AWS. It's important to note that we are also providing the risUserData property that allows users to specify
an script that is executed when the instance is initialized. In our case we have mounted an script like the following:
#!/bin/bash
rm -f /opt/monitor_config.json\necho '<json-conf>' > /opt/monitor_config.json
where <json-conf> is generated dynamically and has all of the information necessary for the monitor client to send requests
to the monitor and adjust its data sampling. For example:
{"samplingLambda":9,"pushFrequencySecs":15,"asgServerHost":"172.31.90.116","asgServerPort":50051}
where the fields have already been explained in the previous section.
terminateInstance terminates an instances given an instance-id.
src/AutoScalingGroup/CRUD.hs
The CRUD.hs module implements the operations for inserting and querying instances and metrics in the Sqlite database whose schema is as follows:
CREATE TABLE instance (
    id                TEXT PRIMARY KEY,
    private_ip        TEXT NOT NULL,
    private_dns_name  TEXT NOT NULL,
    created_at        DATETIME,
    UNIQUE(private_ip),
    UNIQUE(private_dns_name)
);

CREATE TABLE metric (
    id                   INTEGER PRIMARY KEY AUTOINCREMENT,
    instance_id          TEXT NOT NULL,
    cpu_load_percentage  REAL NOT NULL,
    http_load_percentage REAL NOT NULL,
    created_at           DATETIME,
    CONSTRAINT fk_metric_instance FOREIGN KEY(instance_id) REFERENCES instance(id) ON DELETE CASCADE
);
src/AutoScalingGroup/Ping.hs
The Ping.hs module implements the actions for the thread that checks whether instances are alive, and based on the current instance count it determines whether it should relaunched dead instances if there are less than the minimum quota specified in the configuration file. This module uses the ICMP PING protocol via a unix system call.
src/AutoScalingGroup/Scaling.hs
The Scaling.hs module implements
the main actions for the thread that checks current group capacity and determines whether the cluster should scale up or down.
There are two policies for scaling, namely, http-load and cpu-load. They can be applied separately or combined. This module
checks the average load of all instances that have pushed metrics at a given point in time, and after evaluating the policy,
it decides if the scaling should go up or down (or should not go at all).
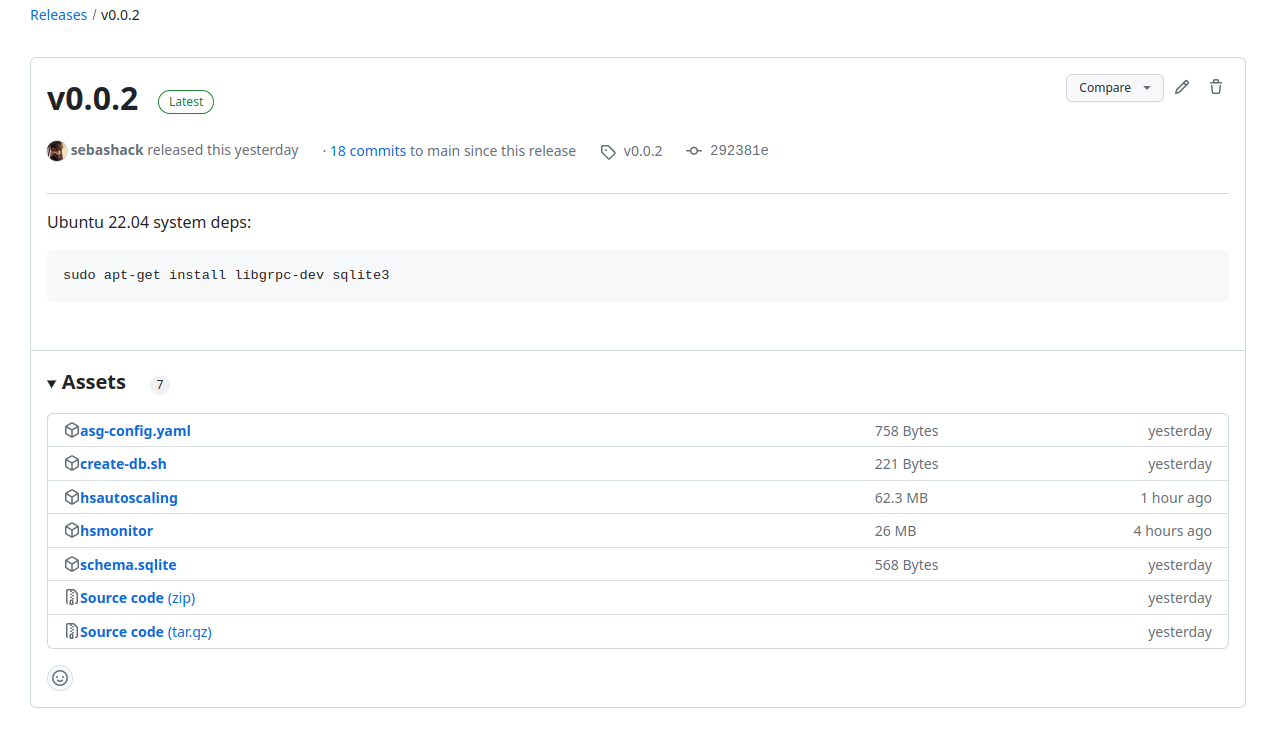
This project was deployed on the AWS cloud. First, a github release with our system binaries was created:
Then a monitor client instance was launched and the hsmonitor was installed together with apache2 server. A service file
was also implemented for it:
[Unit]
Description=Monitor client service

[Service]
User=root
WorkingDirectory=/opt/asg
ExecStart=/opt/asg/hsmonitor
Restart=always
RestartSec=5

[Install]
WantedBy=multi-user.target
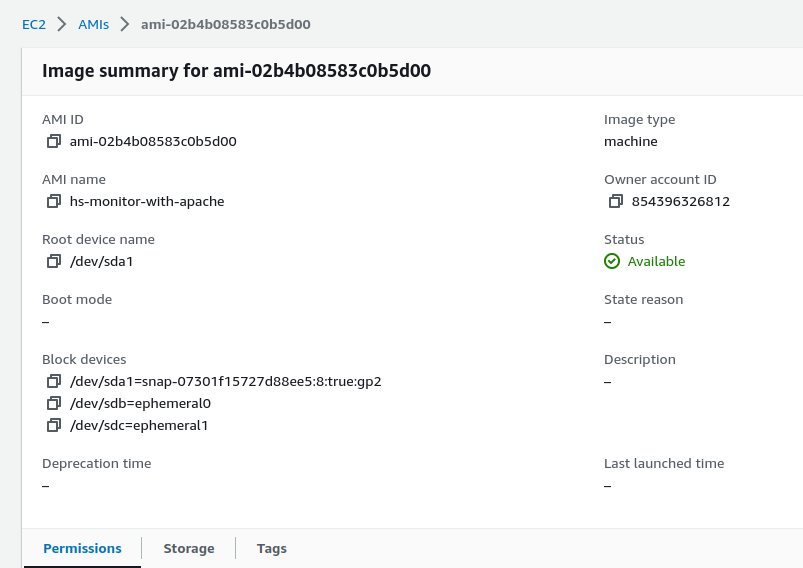
Once we verified that the monitor was working well and sending metrics to the server, we created an ami out of it:
The monitor server was also deployed on a ec2 instance and the configuration file was properly set for this production
environment. The ami above was used in the config:
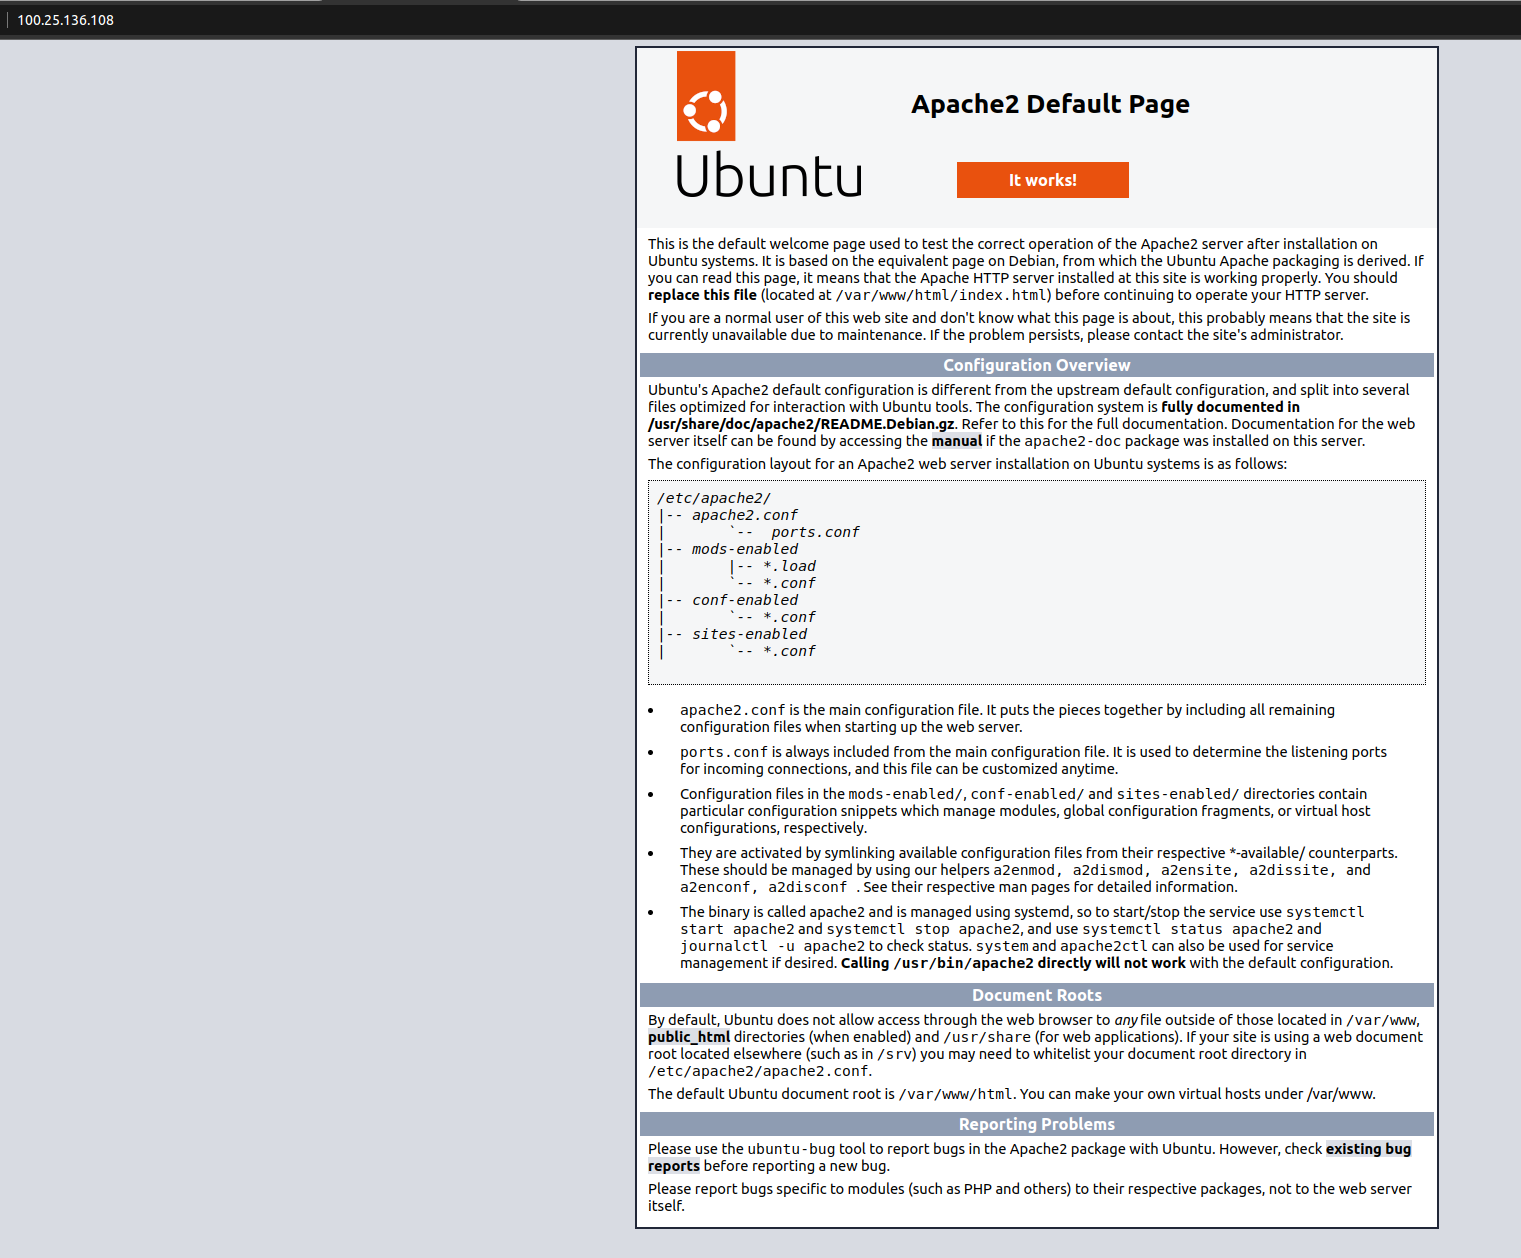
After deployment we checked that Apache was serving the example web page:


