Библиотеки
library(data.table)
library(tidyverse)
library(gganimate)
Данные
Используется база данных о результатах команд за последние 15 сезонов в НБА. Данные находятся в файле standings.csv в папке data
Работа с данными
Создаём новые столбцы с количевством побед, рангом в каждом году и отношением к лучшему показателю за год.
  table1 <- table1[SeasonID >= as.numeric(paste(2, first_season, sep = ""))
                   & SeasonID <= as.numeric(paste(2, last_season, sep = ""))][
    ,.(TeamName, WINS)][
      , CumWins := cumsum(WINS), by = "TeamName"][
        ,year := rep(seq(first_season, last_season),
                     each = length(unique(table1$TeamName)))][
          , cumrank := frank(-CumWins, ties.method = "random"), by = "year"][
            , value_rel := CumWins/CumWins[cumrank==1], by = "year"]
Построение графика
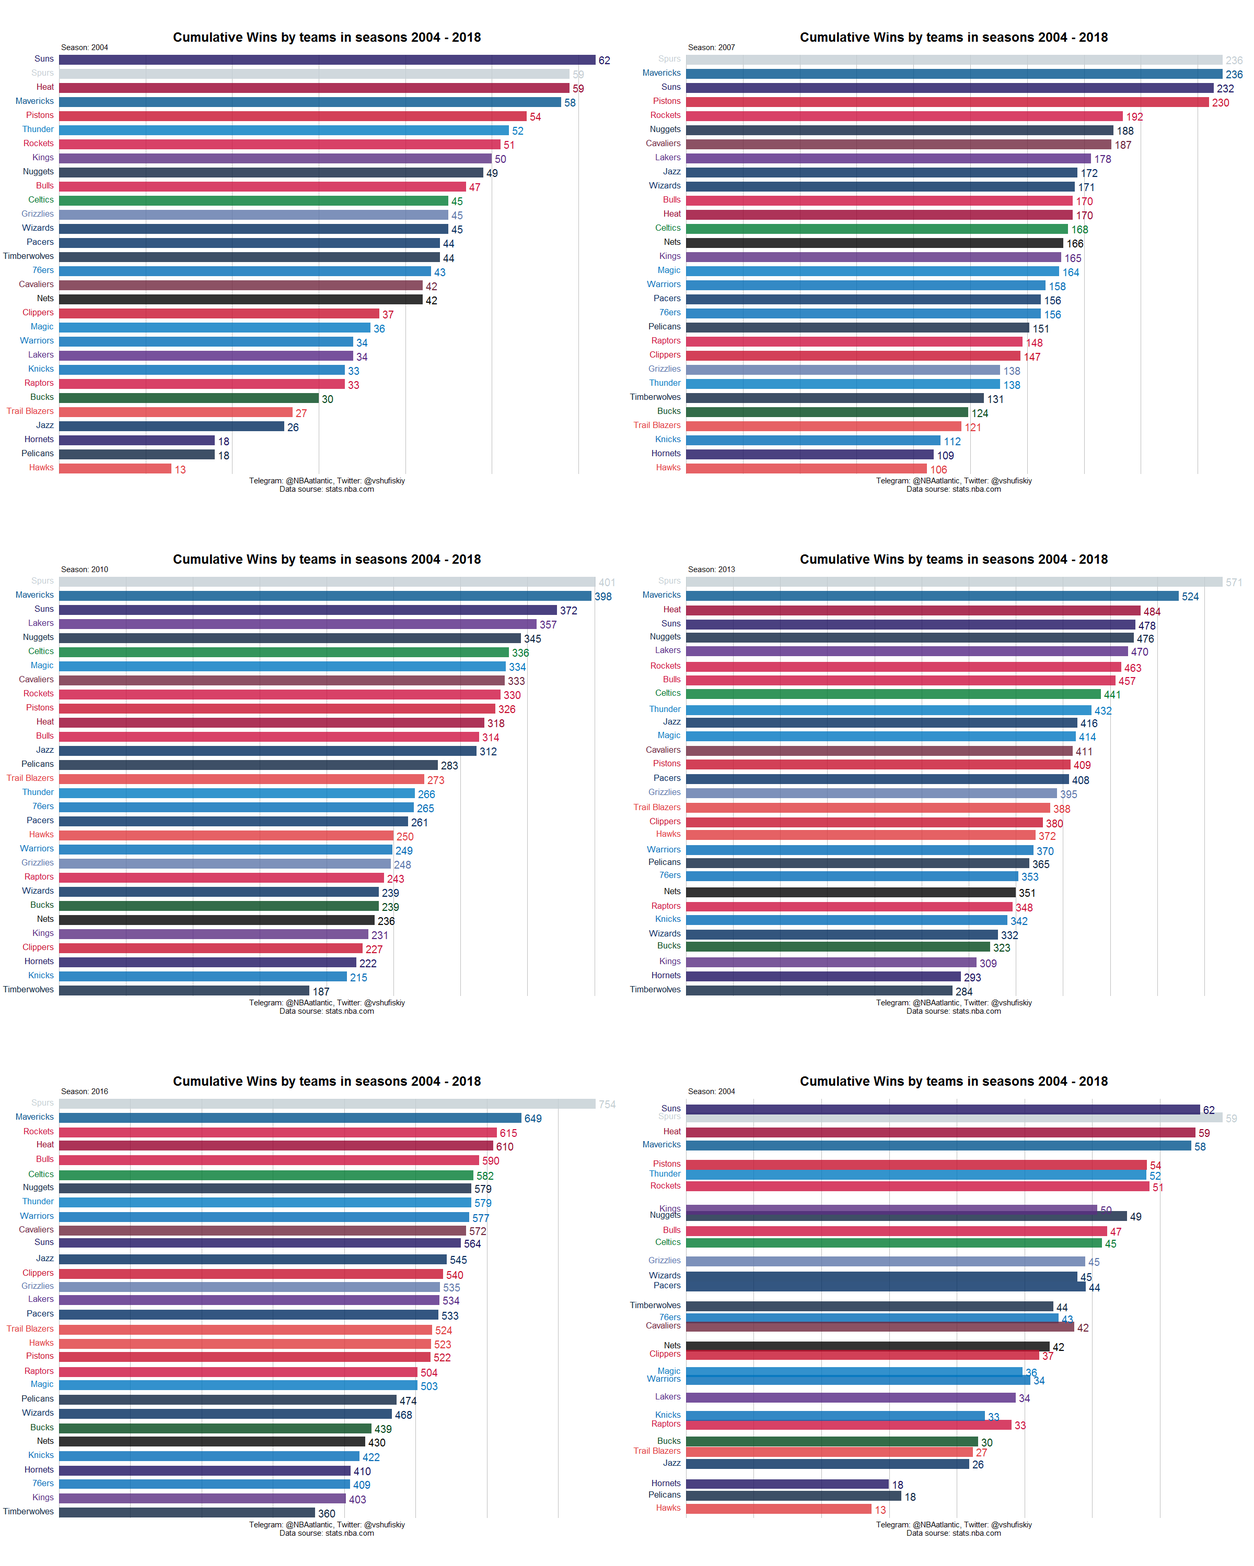
Строим графики для каждого сезона с помощью ggplot2:
gg <- ggplot(table1, aes(cumrank, group = TeamName, fill = as.factor(TeamName),
                           color = as.factor(TeamName))) +
    geom_tile(aes(y = CumWins/2,
                  height = CumWins,
                  width = 0.7), color = NA, alpha = 0.8) +
    geom_text(aes(y = 0, label = paste(TeamName, " ")), vjust = 0.2, hjust = 1, size = 6) +
    geom_text(aes(y = CumWins, label = paste0(" ",round(CumWins))), hjust = 0, size = 7) +
    coord_flip(clip = "off", expand = FALSE) +
    scale_fill_manual(values = cols) +
    scale_color_manual(values = cols) +
    scale_y_continuous(labels = scales::comma) +
    scale_x_reverse() +
    guides(color = FALSE, fill = FALSE) +
    theme(axis.line=element_blank(),
          axis.text.x=element_blank(),
          axis.text.y=element_blank(),
          axis.ticks=element_blank(),
          axis.title.x=element_blank(),
          axis.title.y=element_blank(),
          legend.position="none",
          panel.background=element_blank(),
          panel.border=element_blank(),
          panel.grid.major=element_blank(),
          panel.grid.minor=element_blank(),
          panel.grid.major.x = element_line( size=.1, color="grey" ),
          panel.grid.minor.x = element_line( size=.1, color="grey" ),
          plot.title=element_text(size=25, hjust=0.5, face="bold", colour="black",
                                  vjust=-1),
          plot.subtitle = element_text(size = 15),
          plot.caption =element_text(size=15, hjust=0.5, color="black"),
          plot.background=element_blank(),
          plot.margin = margin(2,2, 2, 4, "cm"))
Анимация
С помощью функции {r} transition_states() создаём анимированный график для каждого года в отдельности.
  anim <- gg + transition_states(year, transition_length = 4, state_length = 1) +
    view_follow(fixed_x = TRUE)  +
    labs(title = paste("Cumulative Wins by teams in seasons",
                       first_season, "-", last_season, sep = " "),
         subtitle = paste(if (elements %in% select_div ){
           paste(elements, "Division", sep = " ")
         } else if (elements %in% select_conf ){
           paste("Conference", elements, sep = " ")
         }, "Season: {closest_state}", sep = " "),
         caption  = "Telegram: @NBAatlantic, Twitter: @vshufiskiy\nData sourse: stats.nba.com")
Рендеринг
  animate(anim, nframes = (last_season - first_season + 1) * (length(unique(table1$TeamName)) + 20),
          fps = 20,  width = 1200, height = 1000,
          renderer = gifski_renderer(paste(elements[1], "cumwins.gif", sep = "_")))
Результат
Полное описание процесса создания в статье на Хабре
