Making SLOs with Prometheus manageable, accessible, and easy to use for everyone!
-
Support for Kubernetes, Docker, and filesystem
-
Alerting: Generates 4 Multi Burn Rate Alerts with different severity
-
Page listing all Service Level Objectives
- All columns sortable
- Sorted by remaining error budget to see worst ones quickly
- Tool-tips when hovering for extra context
-
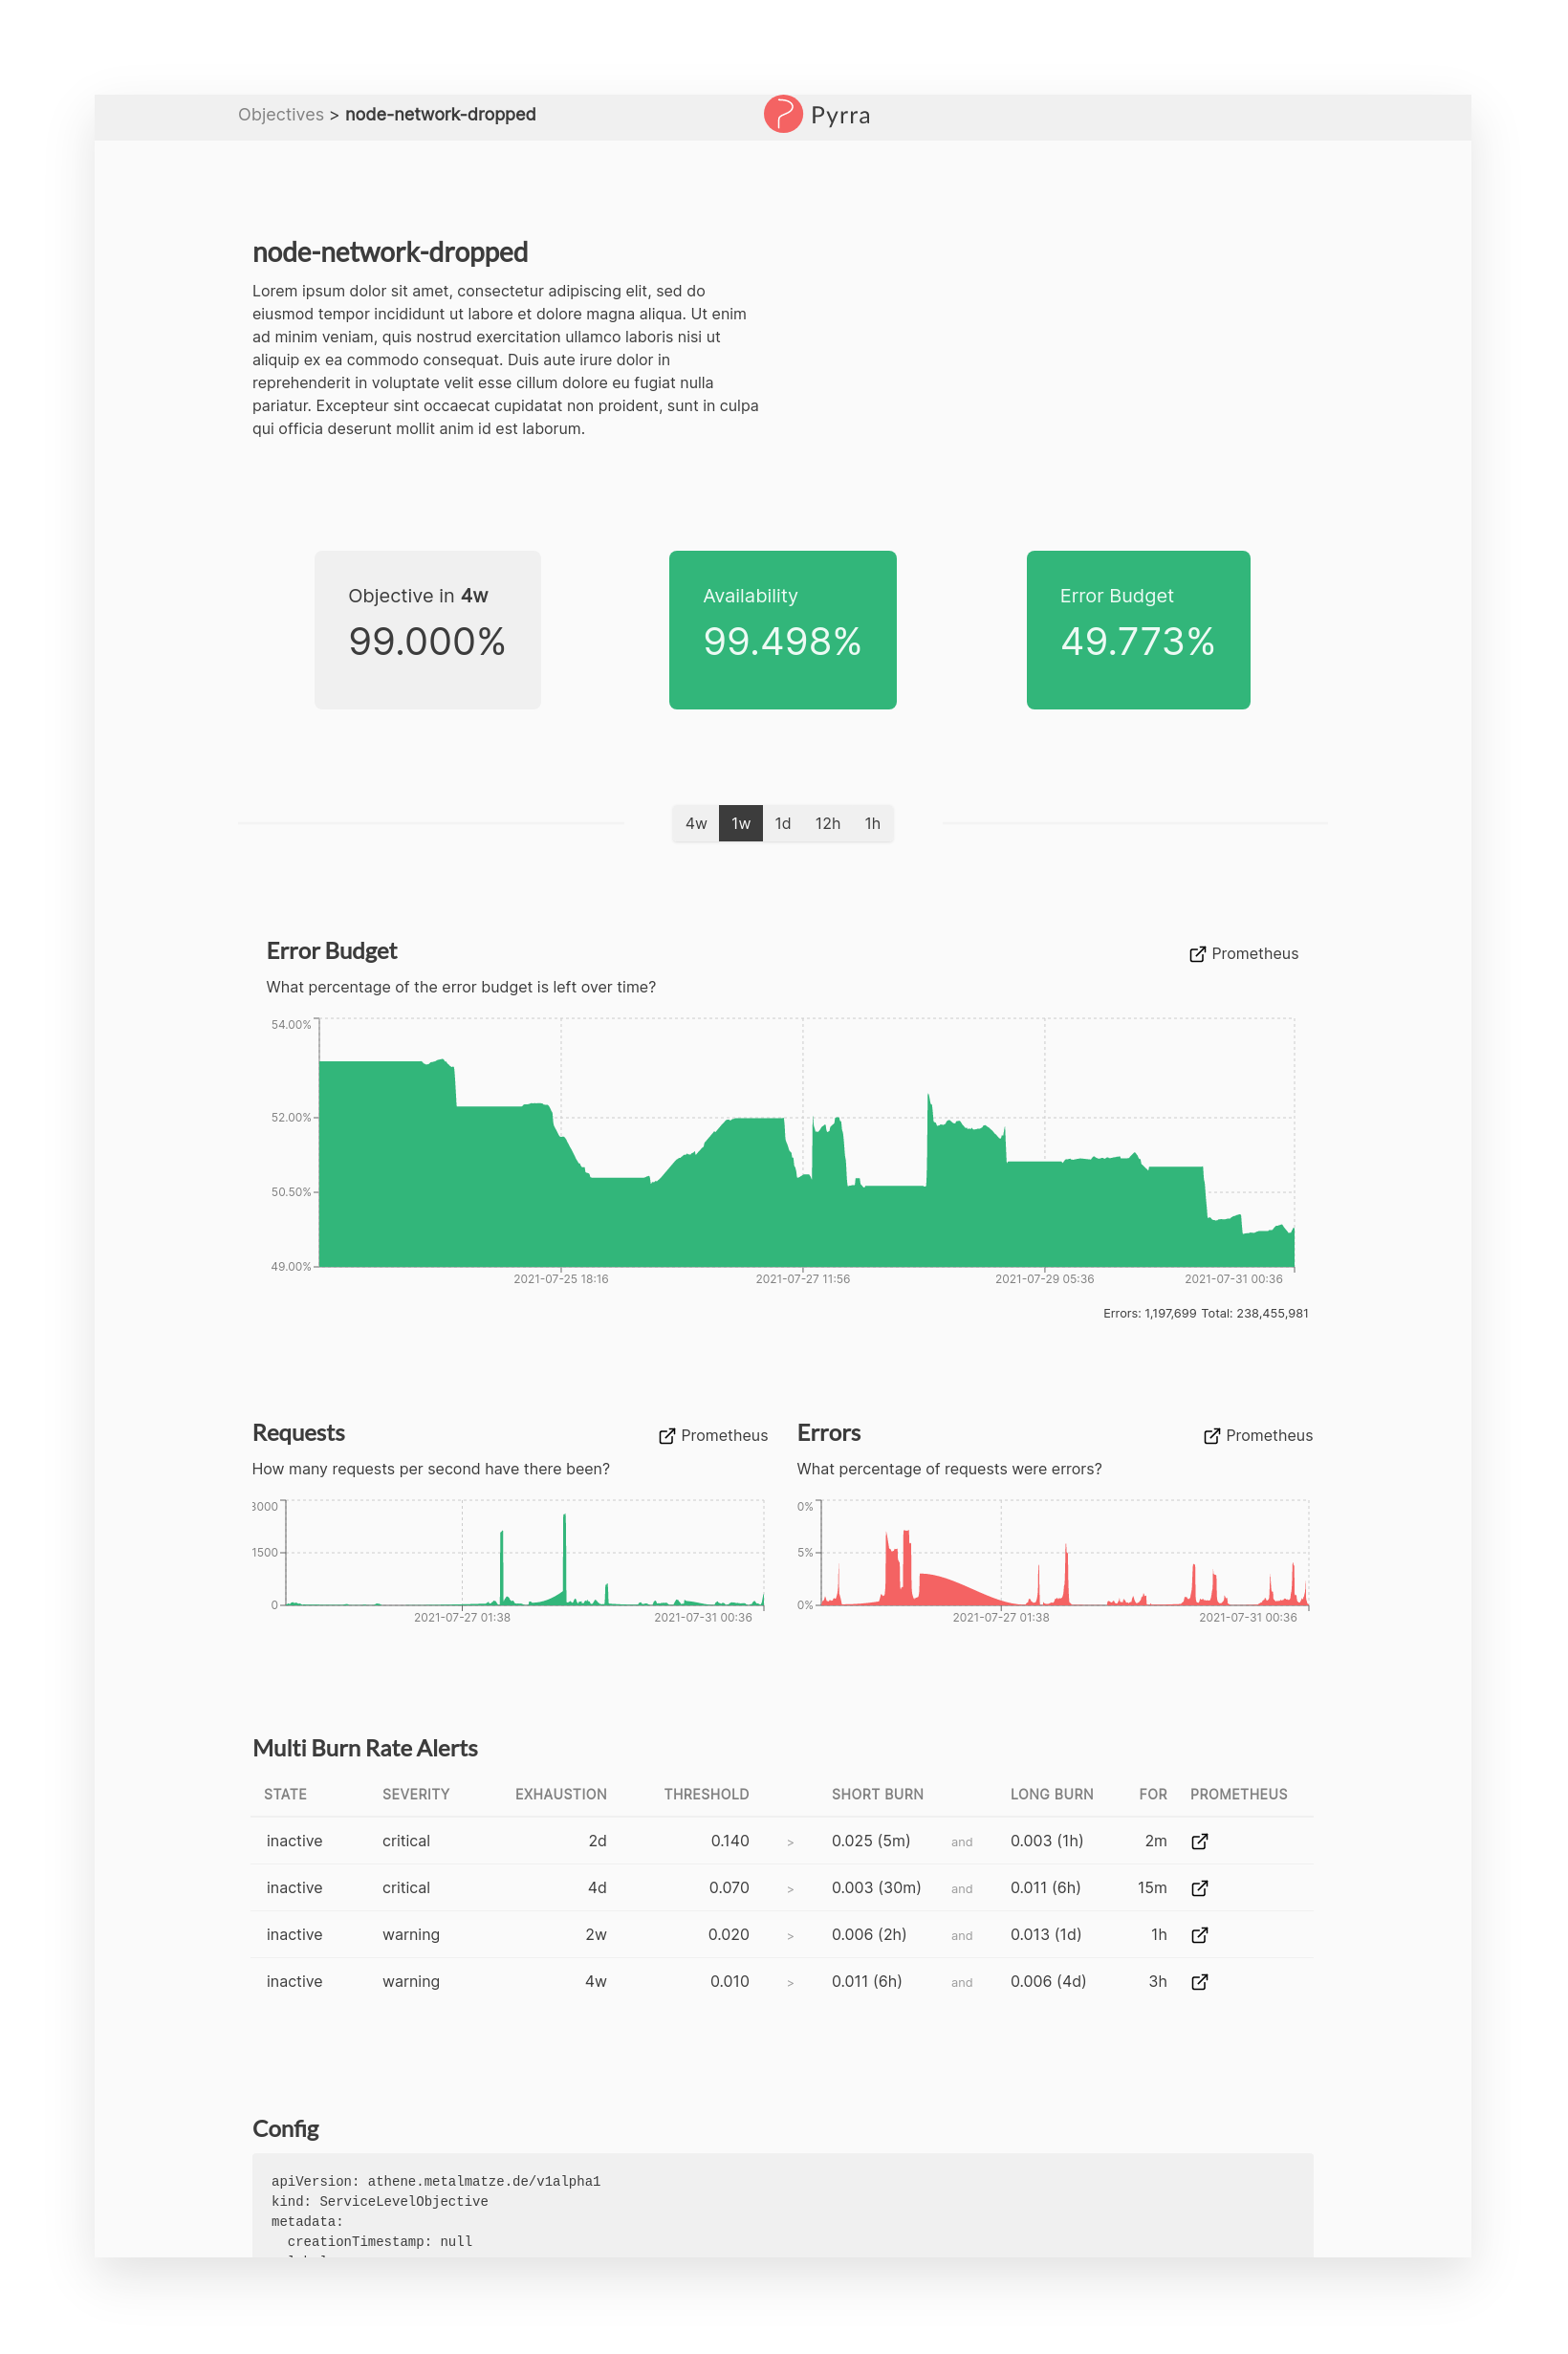
Page with details for a Service Level Objective
- Objective, Availability, Error Budget highlighted as 3 most important numbers
- Graph to see how the error budget develops over time
- Time range picker to change graphs
- Request, Errors, Duration (RED) graphs for the underlying service
- Multi Burn Rate Alerts overview table
-
Caching of Prometheus query results
-
Thanos: Disabling of partial responses and downsampling to 5m and 1h
-
OpenAPI generated API
If you have any feedback, please open a discussion in the GitHub Discussions of this project.
We would love to learn what you think!
@aditya-konarde, @brancz, @cbrgm, @codesome, @ekeih, @guusvw, @jzelinskie, @kakkoyun, @lilic, @markusressel, @morremeyer, @mxinden, @numbleroot, @paulfantom, @RiRa12621, @tboerger, and Maria Franke.
While we were working on Pyrra in private these amazing people helped us with a look of feedback and some even took an extra hour for a in-depth testing! Thank you all so much!
Additionally, @metalmatze would like to thank Polar Signals for allowing us to work on this project in his 20% time.
Check out our live demo on demo.pyrra.dev!
Feel free to give it a try there!
There are pre-build container images available:
docker pull ghcr.io/pyrra-dev/pyrra:mainWhile running Pyrra on its own works there won't be any SLO configured nor will there be any data from a Prometheus to work with.
Therefore, you can find a docker-compose example in examples/docker-compose.
This stack comes with Pyrra and Prometheus pre-configured, as well as some SLOs.
Client: TypeScript with React, Bootstrap, Recharts
Server: Go with libraries such as: chi, ristretto, xxhash, client-go.
OpenAPI generated API with server (Go) and clients (Go & TypeScript).
You need to have Go and Node installed.
Clone the project
git clone https://github.com/pyrra-dev/pyrra.gitGo to the project directory
cd pyrraInstall dependencies
make installBuild the UI and compile the Go binaries
makeRun the API binary in one terminal
./bin/apiNote: the API assumes a Prometheus is running on localhost:9090 and a backend on localhost:9444) by default. Check ./bin/api --help flag for the parameters to change those.
Run the filesystem binary in another terminal
./bin/filesystemOr run the Kubernetes binary in the other terminal
./bin/kubernetesNote: This binary tries to run against your default Kubernetes context. Use the -kubeconfig flag to change for another kubeconfig
Run the Node server to work on the UI itself
cd ui
npm run start
Note: This still needs the API and one of the backends to really work.
Most likely you need to update the window.PUBLIC_API constant in ui/public/index.html.
-    <script>window.PUBLIC_API = '/'</script>
+ <script>window.PUBLIC_API = 'http://localhost:9099/'</script>Best to check the Projects board and if you cannot find what you're looking for feel free to open an issue!
Contributions are always welcome!
See contributing.md for ways to get started.
Please adhere to this project's code of conduct.
| Name | Area | GitHub | Company | |
|---|---|---|---|---|
| Nadine Vehling | UI / UX | @nadinevehling | @nadinevehling | Grafana Labs |
| Matthias Loibl | Engineering | @metalmatze | @metalmatze | Polar Signals |
We are mostly maintaining Pyrra in our free time.
Right now we could have used Grafana indeed. In upcoming releases, we plan to add more interactive features to give you better context when coming up with new SLOs. This is something we couldn't do with Grafana.
Yes, Grafana is an amazing data visualization tool for Prometheus metrics. You can create your own custom dashboards and dive a lot deeper into each component while debugging.
Yes, in fact I've been developing this against my little Thanos cluster most of the time.
The queries even dynamically add headers for downsampling and disable partial responses.
It depends on the topology of your infrastructure, however, we think that alerting should still happen within each individual Prometheus and therefore running one instance with one Prometheus (pair) makes the most sense. Pyrra itself only needs one instance per Prometheus (pair).
For now, we try to accomplish an easy-to-setup workflow for the most common SLOs. It is still possible to write these more complex SLOs manually and deploy them to Prometheus along those generated. You can base more complex SLOs on the output of one SLO from this tool.
Kubebuilder doesn't support floats in CRDs...
Therefore, we need to pass it as string and internally convert it from string to float64.
Here are some related projects:
