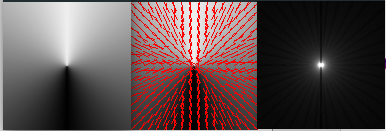
Histogram of oriented gradients visualisation using OpenCV
Step by step calculation, so not all methods and loops are optimal. Feel free to use and comment.
Dependencies:
- OpenCV for Python
- Python 3.4
Implementation:
- cropped to 128x128 image
- 8x8 patch histogram calculation
- 16x16 patch normalization for feature descriptor
- 8x8 normalization to visualise only on image
More info about HOG:
