Deploying Loki and Grafana to a cluster and an agent to forward pod logs
This repo deploys a simple setup of:
- Loki - For log storage
- Grafana - For viewing and querying of logs stored in Loki
- Vector - As a log agent forwarding pod logs to Loki
Export your Digital Ocean token
export DO_TOKEN="rklfagjiotjgo"Create tfvars files so the Terraform provider knows the token
cat <<EOF | tee ./cluster_tf/token.auto.tfvars ./manifest_tf/token.auto.tfvars
do_token = "${DO_TOKEN}"
EOFRun the terraform under ./cluster_tf which will create a Digital Ocean Managed Kubernetes Cluster.
The kubeconfig for the cluster is an output so you can copy that to ~/.kube/config to access the cluster with kubectl.
Run with:
terraform init
terraform plan -out=out
Review the plan, then apply with
terraform apply out
You should now have a managed kubernetes cluster which costs ~$45/month
Now to deploy Loki, Grafana and Vector. This is made rather easy with the use of Helm charts.
Run te terraform under ./manifests_tf.
Run with:
terraform init
terraform plan -out=out
Review the plan, then apply with
terraform apply out
The output of kubectl get pods should result in something like below:
NAME                      READY   STATUS    RESTARTS   AGE
grafana-658ccccbb-47cbn   1/1     Running   0          64m
loki-0                    1/1     Running   0          69m
vector-agent-2l7tg        1/1     Running   0          31m
vector-agent-bwmq9        1/1     Running   7          39m
vector-agent-wk48f        1/1     Running   7          37m
As we've not configured Grafana to not use an ingress you'll need to port forward to it. Before you port forward to Grafana you'll need the admin password which you can get with the following command.
kubectl get secret grafana -o jsonpath="{.data.admin-password}" | base64 -dPort forward with:
kubectl port-forward deploy/grafana 3000:3000Grafana should now be accessible on "http://localhost:3000".
Log in with the username of admin and the password which you got earlier.
On the left, click the Cog Wheel and select Datasources.
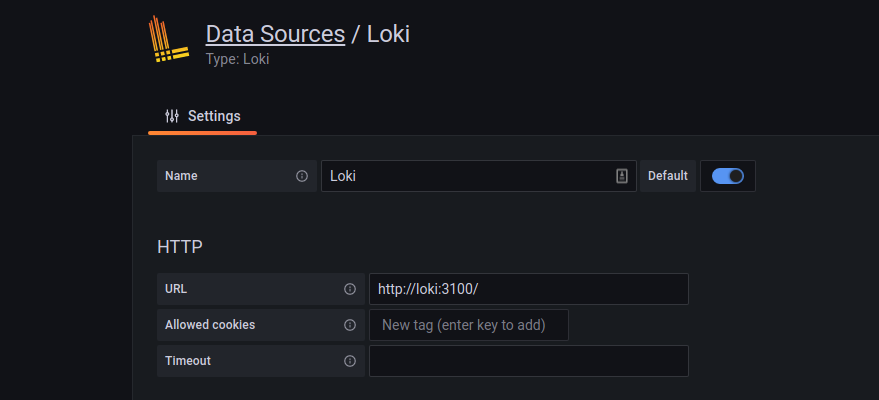
Select Loki
The only value needed here to get started is the Loki URL. As the Loki Helm chart sets up a Kubernetes Service resource, you
can access Loki in the cluster using the domain name of loki so the URL http://loki:3100 should suffice.
Then at the bottom hit "Save & test". The page wont change, you'll just get a notification on the right saying its successful.
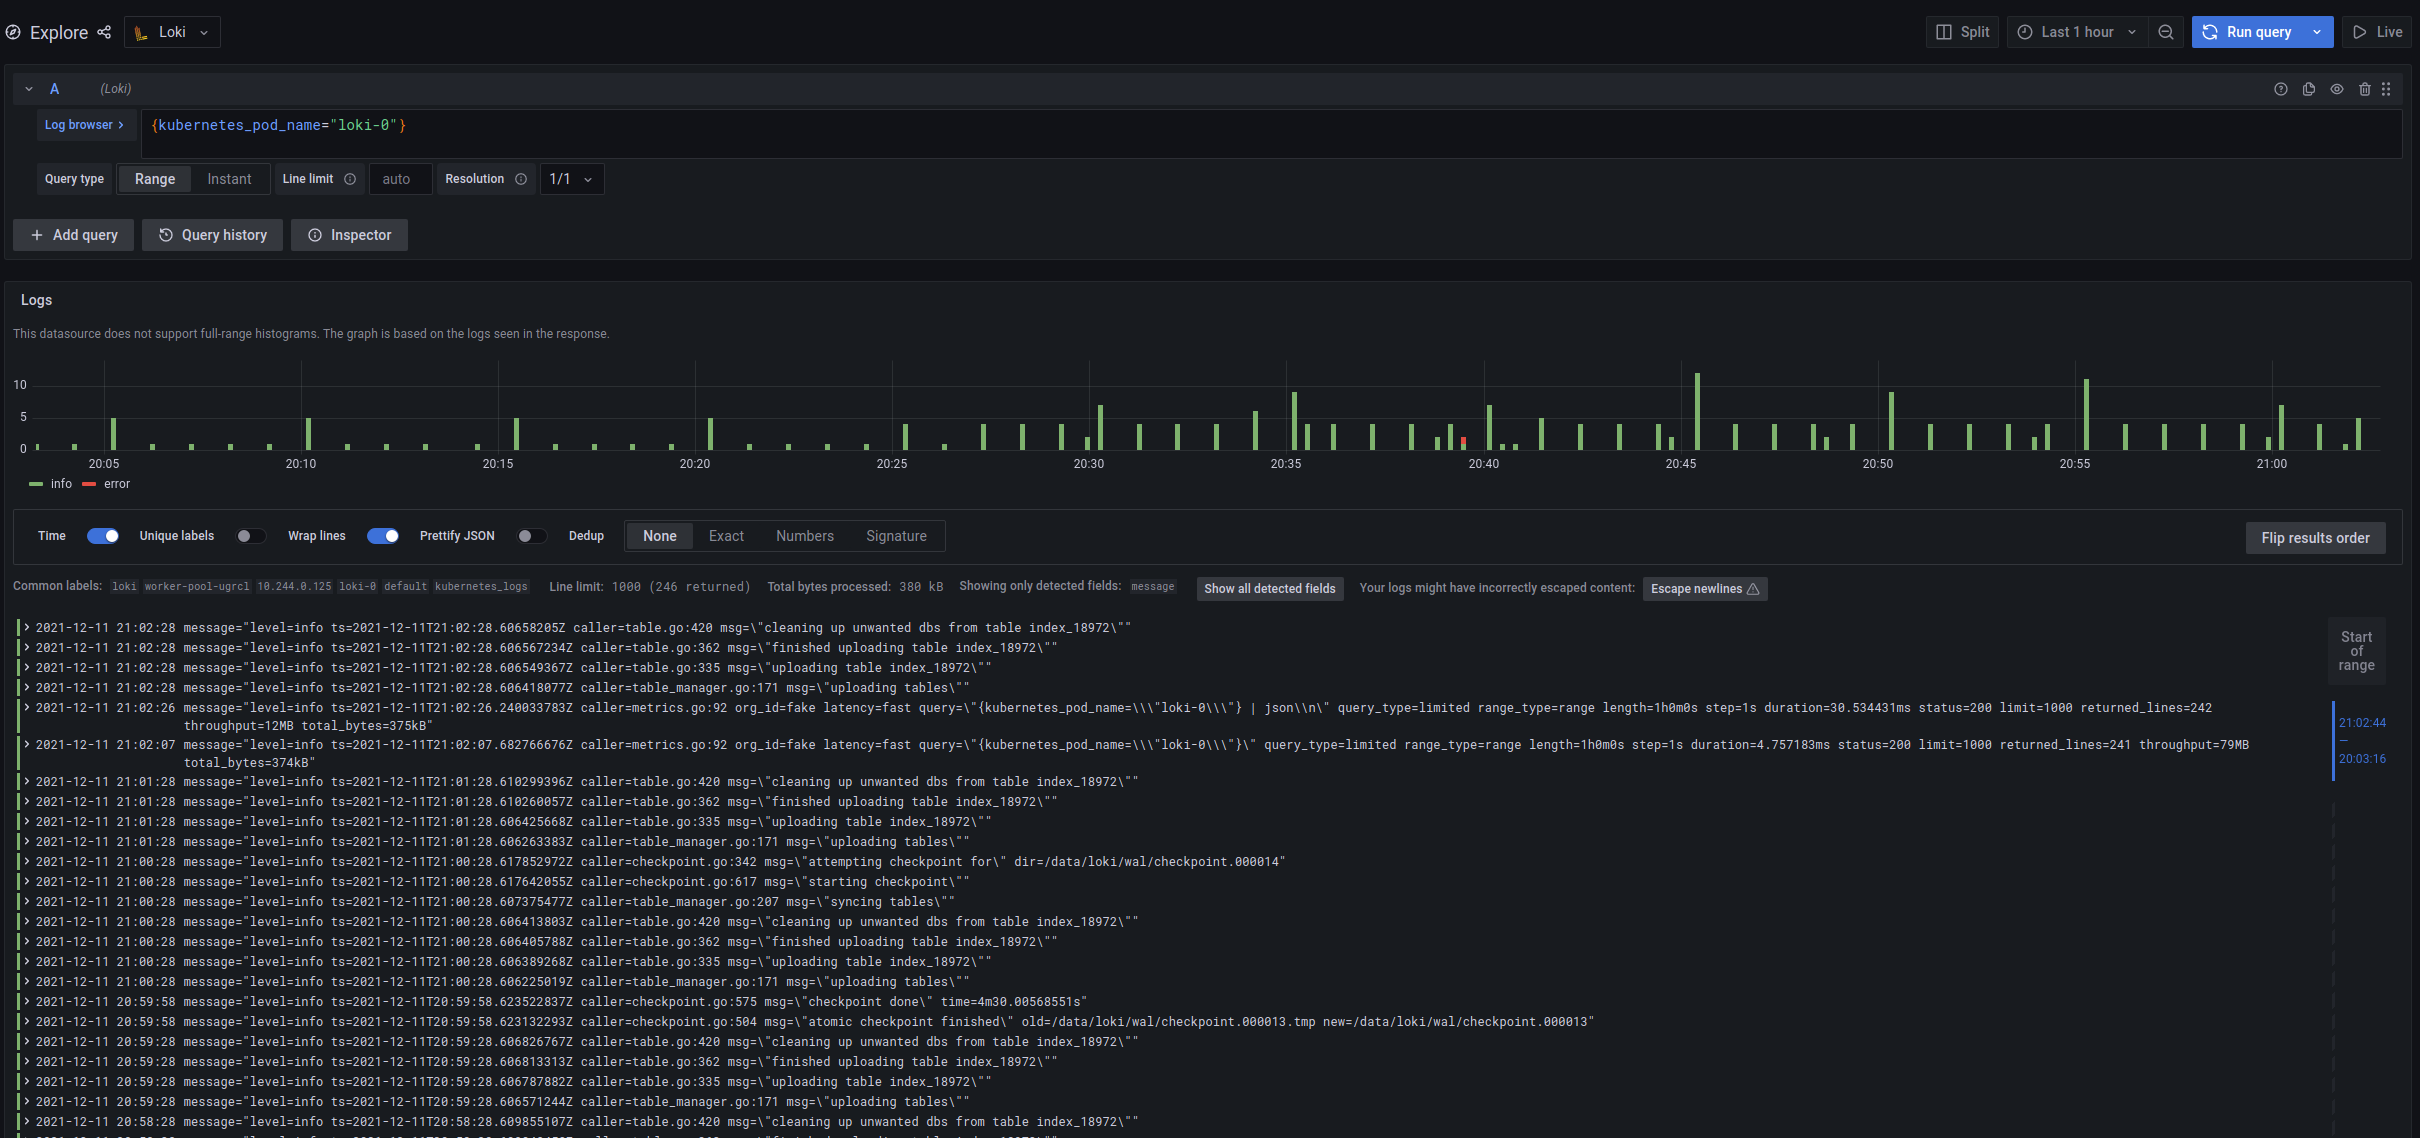
On the left there is a compass icon, this lets you explore data i.e Logs.
In the ./manifests_tf/vector.tf file there is some config for how Vector labels data. It has only been configured with a few labels
one of which is the pod name. So using that we can query Loki for logs from the loki-0 pod with the following log query:
{kubernetes_pod_name="loki-0"}
You should then see lots of logs, if you expand the first log entry, there will be an eye button next to fields, if you select the eye button next to the messages field then collapse the log item, you'll see a much more concise set of logs, newest first.
So I think the Digital Ocean Kubernetes challenge is a great idea, I definitely would not have made time to play around with setting up Loki, Grafana and Vector to test with otherwise, and the swag is definitely a good incentive too :)
The simplicitly of setting up a Kubernetes cluster in DO is unrivialed, having ran Kube clusters in AWS and Azure, this took all of a few minutes. It took longer to get my API token than to run the terraform to create a Kube cluster. The price is decent too, for 3 nodes it costs ~$45/month and at least on AWS the control plane alone costs around $71/month, the free control plane on DO really makes a difference :).
Grafana, obviously is a great bit of software as is Loki. In terms of setup Loki seems decent but would need a fair amount of configuration to store logs in a cloud object store like S3. The storage of logs is the simple part, its a shame theres not many options for the index storage which doesnt seem to support any PAAS offerings that DO offer. Vector seems like a viable log shipping agent though it would probably take a reasonable amount of work configuring it to store application logs in Loki in a useful format thats easily queryable.

