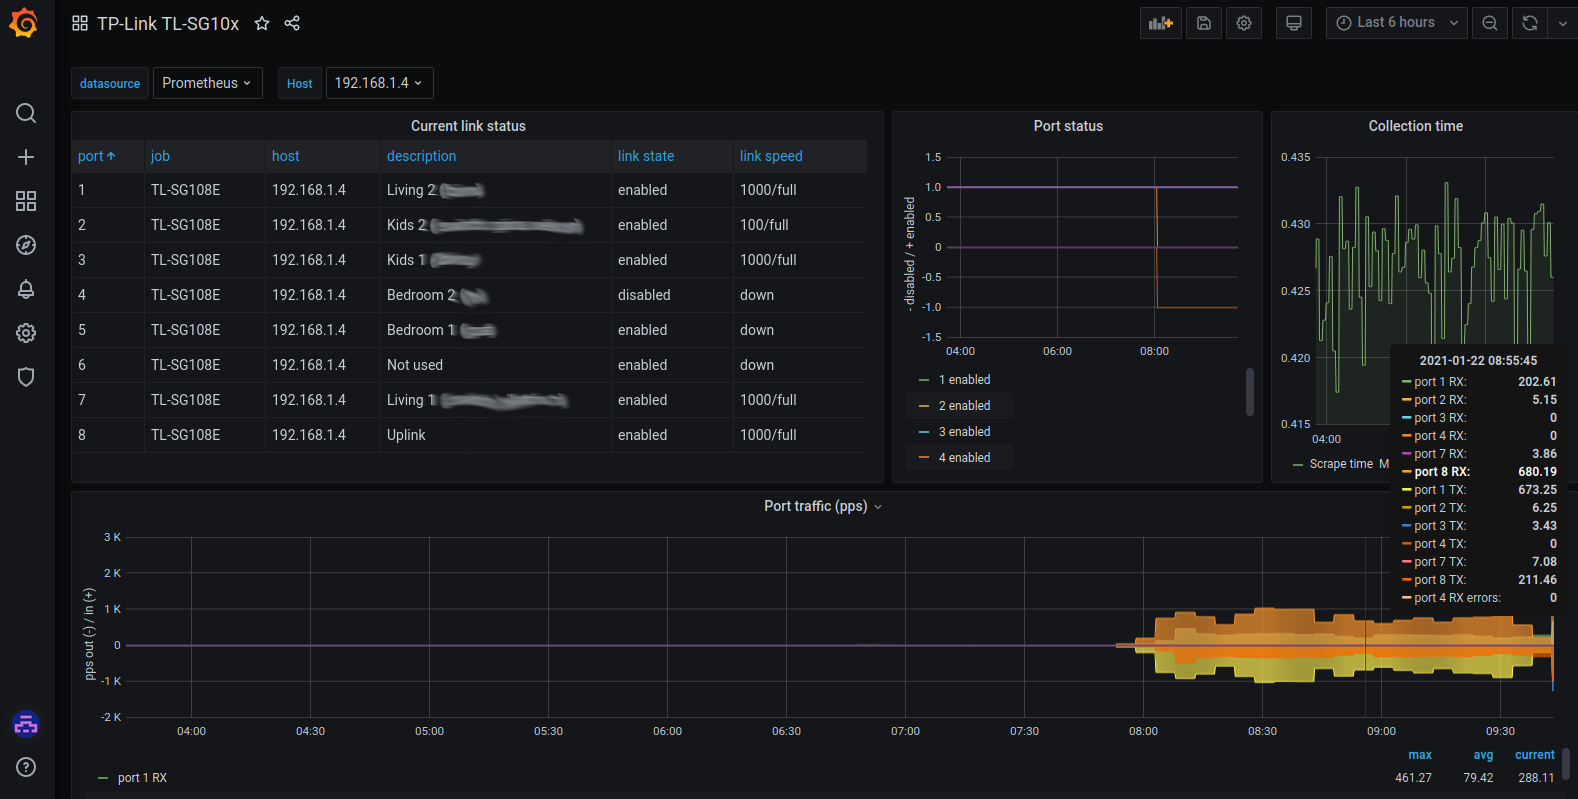
Prometheus Exporter for the TPLink TL-SG10xE series switches with web management. It uses web scraping to get port speed, port status and port packet counters.
The code was confirmed to run correctly on:
- TL-SG108E 2.0
Supported firmware versions:
- 1.0.2 Build 20160526 Rel.34615
Check out the sample configuration in tl-sg-prometheus-exporter.yaml. You will need to define a port for the exporter to listen to (e.g. 8000), and also define a list of one or more switches to be polled for data. You can populate port_descriptions to also expose meaningful descriptions for your switch ports (sadly it's a missing feature in the switches).
Note that you can (and should) use cache_login: True if you intend to poll very often for metrics (e.g. every 10 seconds). It will skip the login and go directly to the page that holds the counters. If you poll less often you will need to set cache_login: False, and this will cause the script to login each time it reads data. Note that by default, the switch expires sessions pretty quickly (in about a minute of inactivity).
git clone https://github.com/mad-ady/tl-sg-prometheus-exporter.git
cd tl-sg-prometheus-exporter
sudo pip3 install -r requirements.txt
sudo cp tl-sg-prometheus-exporter.yaml /etc
sudo vi /etc/tl-sg-prometheus-exporter.yaml
sudo cp tl-sg-prometheus-exporter.py /usr/local/bin
sudo cp tl-sg-prometheus-exporter.service /etc/systemd/system
sudo systemctl enable tl-sg-prometheus-exporter
sudo systemctl start tl-sg-prometheus-exporter
sudo journalctl -f -u tl-sg-prometheus-exporter
A Docker image is provided. You can run it with a command like:
docker run -it -p 8000:8000 -v /path/to/tl-sg-prometheus-exporter.yaml:/app/config.yaml ghcr.io/mad-ady/tl-sg-prometheus-exporter:main
Where /path/to/tl-sg-prometheus-exporter.yaml is the location of your configuration YAML file.
The container image is currently built for AMD64 and ARM64 architectures.
Traffic to the switches uses plain HTTP. The password is also sent in clear-text (as a HTTP POST request). When cache_login: False, the script logs in each time it needs to get the metrics. This is because of how the switches are designed to operate. In insecure environments consider tunneling the traffic through ssh tunnels (though traffic will still be unencrypted when it reaches the switch).
The passwords are also stored in clear-text inside the configuration file.
When polling multiple devices, polling is done serially. For use with many devices it would be wise to rewrite the collection process and poll them in threads. PRs welcome.
You can use this dashboard with Grafana to display data collected by this exporter: https://grafana.com/grafana/dashboards/13760
