Performance issue in `sliceAnsi` function
AlCalzone opened this issue · 9 comments
I noticed that when there are multiple components that frequently render, like the ink-spinner component, my application ends up with high CPU load. A somewhat complex screen goes from 0.5 to 25% CPU usage when there are 3 spinners rendered.
So far, I've traced it to the sliceAnsi function calls in Output.get(). Will investigate further if I can see which part of that function seems to cause this.
Here's a simple component to reproduce:
import { Box, render, Text } from "ink";
import Spinner from "ink-spinner";

const Root: React.FC = () => {
  const numSpinners = 10;
  const loop = new Array(numSpinners).fill(0);
  return (
    <Box flexDirection="row" borderColor="blue" borderStyle="round">
      {loop.map((_, i) => (
        <Box key={i} borderColor="white" borderStyle="double">
          <Text color="green">
            <Spinner type="dots" />
          </Text>
        </Box>
      ))}
    </Box>
  );
};

render(<Root />);
With just 10 spinners, I get significant slowdown. 30 spinners bump the CPU usage up to almost 100%.
I understand this might better be opened in the slice-ansi repo, but maybe there's something on the consumer side to improve performance too, e.g. caching calls to sliceAnsi etc.
Could you share some details how you traced the performance issues to slice-ansi? Also, interesting to follow your PR to slice-ansi, curious how it works out.
I executed the process in VSCode with debugger attached, then captured a performance profile for a couple of seconds. That showed that most of the time was spent in sliceAnsi.
I can share some screenshots if you like.
There should also be a way to do it with command line flags to node.js, but I find the above easier.
Yep, would be cool to see the details. Perhaps there are some other things that are standing out that we could optimize?
Ok, so here's a video:
ink-repro-1679087887312.mp4
At the end you see how much time is spent in each function, self time is the time the function itself was executing, total time includes the functions it calls. So a method with a high self-time is worth looking at.
You can also switch to a flamegraph to see the time slices over the entire execution time, or switch it to the left-heavy view to group the calls by callstack:
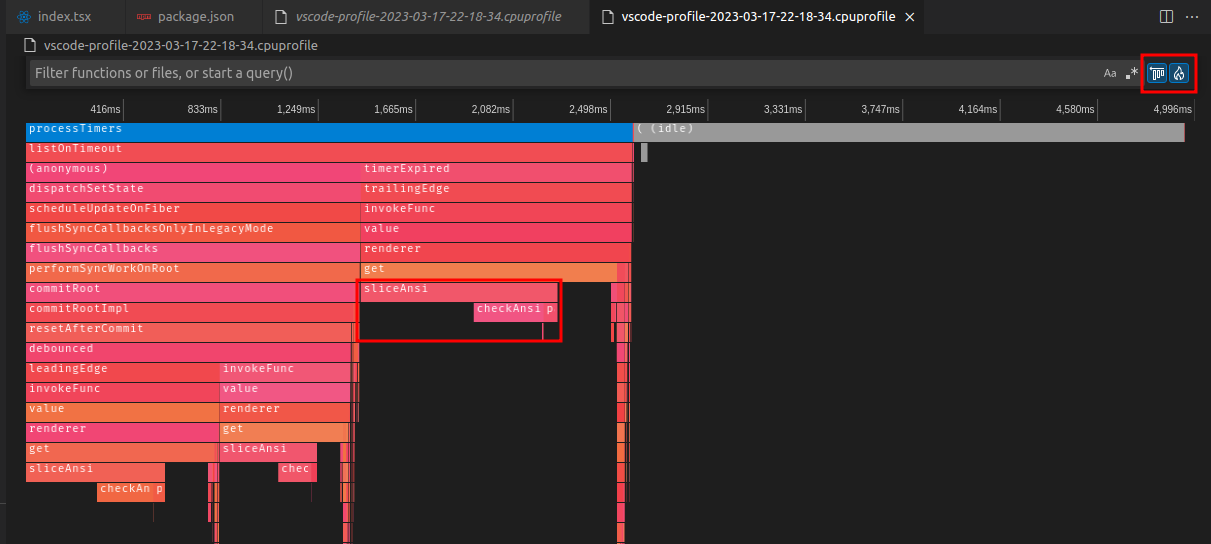
As you can see, slice-ansi and check-ansi take up most of the execution time of the renderer (and this graph is already with my optimized version which is almost 100% faster).
Perhaps there are some other things that are standing out that we could optimize?
Not sure if this is an issue with ink specifically, but when using the ink-table component (I have a fork that's ready for ink 4.0), there are a lot of writes handled in Output.get. This table results in about 300 writes per call, roughly 60 per line:

And each write calls the expensive sliceAnsi method twice per line it contains.
Often this is done for lines that have been partially sliced before, so a lot of the work in sliceAnsi is repeated.
Perhaps a better way to collect the output would be to "tokenize", storing which character and styling a "pixel" contains, and using that at the end to generate the whole string at once?
Not sure if this is an issue with ink specifically, but when using the ink-table component (I have a fork that's ready for ink 4.0), there are a lot of writes handled in Output.get. This table results in about 300 writes per call, roughly 60 per line
Yep, that's what Ink does. It creates a separate write in Output for every component.
Perhaps a better way to collect the output would be to "tokenize", storing which character and styling a "pixel" contains, and using that at the end to generate the whole string at once?
I don't understand, could you elaborate?
Ok, let's try an example. Suppose you want to collect 3 writes in a single line of length 20, without clipping or transforms for simplicity. Also I'll use r for a red "r", g for a green "g" and b for a blue "b", so I can explain it without using colors.
The 1st write shall be rgrgrgrgrgrgrgrgrgrg, so the result of chalk.red("r") + chalk.green("g"), repeated 10x.
Output.get() will first allocate 20 spaces, then overwrite the entire line with rgrgrgrgrgrgrgrgrgrg. So far, so good.
The 2nd write shall be bbb (chalk.blue("bbb")) at x=5 to get to this result: rgrgrbbbrgrgrgrgrgrg
What happens now is:
rgrgrgrgrgrgrgrgrgrgwill be sliced from 0 to 5, meaningsliceAnsiwill loop through the string, parse and keep track of ansi codes, test if chars are unicode, full width, ... until it has collected 5 visible characters. Then it undoes the ansi codes at the end.bbbwill be appendedrgrgrgrgrgrgrgrgrgrgwill be sliced again, this time from 8 to the end, meaningsliceAnsiwill loop through the string again, do the same work plus a bit more until it has seen 8 visible characters. Then it will start with the ansi codes collected so far, keep doing the same until it reaches the end, and undo the ansi codes that are currently active.
The 3rd write shall also be bbb, but at x=12, to get to this result: rgrgrbbbrgrgbbbgrgrg.
Now the same work as above happens again, only with different slice indizes.
What I'm proposing instead would work like this:
Allocate 20 "pixels" in an array. At the start those would be " " without ANSI styles.
First write: set pixel 0 to "r", with ANSI style for red active. Set pixel 1 to "g", with ANSI style for green active, ... etc.
Second write: set pixels 5-7 to "b", with ANSI style for blue active
Third write: set pixels 12-14 to "b", with ANSI style for blue active
At the end, collect all pixels:
Pixel 0 is red, write ANSI style for red, write "r".
Pixel 1 is green, write ANSI styles to get from red to green (probably just the one for green), write "g".
Pixel 2 is red, write ANSI styles to get from green to red, write "g".
...
Pixel 5 is blue, write ANSI styles to get from red to blue, write "b".
Pixel 6 is also blue, write "b".
... and so on.
proof of concept is up in the linked PR.