anytree==2.8.0
openTSNE==0.4.1
scikit-learn>=0.22.0
umap-learn>=0.3.10
tensorflow>=2.0.0 # for using keras dataset
Install all requirements: pip install -r requirements.txt
If using colab environment, we only need to install two packages anytree and openTSNE.
HCt-SNE is compared with:
- The original t-SNE (using openTSNE) [1]
- UMAP [2]
- cat-SNE [3]
References:
[1] Policar, P. G., Strazar, M., & Zupan, B. (2019). openTSNE: a modular Python library for t-SNE dimensionality reduction and embedding. BioRxiv, 731877. (with source code on github)
[2] McInnes, L., Healy, J., & Melville, J. (2018). Umap: Uniform manifold approximation and projection for dimension reduction. arXiv preprint arXiv:1802.03426. (with source code on github)
[3] de Bodt, C., Mulders, D., López-Sánchez, D., Verleysen, M., & Lee, J. A. (2019). Class-aware t-SNE: cat-SNE. In ESANN (pp. 409-414). (with source code on github)
Command-line arguments for HCt-SNE (the version used for the paper)
$ python main.py -h

usage: main.py [-h] [--rerun0] [--rerun1] [--no-score]
               [--dataset_name DATASET_NAME] [--pca PCA] [-n N]
               [--margin MARGIN] [--seed SEED]

optional arguments:
  -h, --help            show this help message and exit
  --rerun0              Rerun original t-SNE
  --rerun1              Rerun new HCt-sne
  --no-score            Do not calculate metric scores
  --seed SEED, -s SEED  Random seed
  --dataset_name DATASET_NAME, -d DATASET_NAME
  --pca PCA             Run PCA on raw data
  -n N                  Number of dataset points
  --margin MARGIN, -m MARGIN
                        Relative margin in triplet loss
Default values for these arguments: pca=0.95 (run PCA on the raw dataset to keep 95% of the variance), seed=2020 (if not set manually), margin=0.5 (relative margin of 0.5).
For testing the method only, consider to run with --no-score option (without calculating the quality scores AUC[R_NX] and AUC[G_NN] since they are O(N^2 log N)).
Example: Run HCt-SNE for a subset of 10K of the CIFAR10 dataset
# run HCt-SNE with CIFAR10 (set -n 50000 for running with full dataset)
python main.py -d cifar10 -n 10000 --margin 0.5 --rerun0 --rerun1 --seed 2020
Run other methods (UMAP, cat-SNE) for comparison (using compare.py script)
# run UMAP with CIFAR10 (set -n 50000 for running with full dataset)
python compare.py -d cifar10 -n 10000 --method umap --seed 2020

# run cat-SNE for CIFAR10. This method is not optimized for large dataset,
# It can just be run with a subset of 10K points
# (and it takes around 1h30 in the colab environment.)
python compare.py -d cifar10 -n 10000 --method catsne --seed 2020HCt-SNE uses the same hyper-parameter of tSNE (for creating the initial embedding) without exaggeration phase.
tsne_kwargs = dict(
    perplexity=50,
    random_state=2020,
    initialization = "pca", # change it to `random` for running different times
    negative_gradient_method = "bh", # use Barnes-Hut acceleration
    learning_rate = "auto", # will be set to N/12
    early_exaggeration = 12,
    early_exaggeration_iter = 250,
    theta=0.5, # parameters for Barnes-Hut tree
}
HCt-SNE implements a new objective function my_kl_divergence_bh and injects into the optimization loop of openTSNE.
hctsne_kwargs = dict(
    ..., # the same arguments as t-SNE as above

    # disable exaggeration
    early_exaggeration = 0,
    early_exaggeration_iter = 0,

    # new objective function that takes
    # the hierarchical constraints in `tree_regularizer`
    negative_gradient_method=partial(
        my_kl_divergence_bh,
        list_regularizers=[(alpha, tree_regularizer)],
        logger=loss_logger,
    )
)
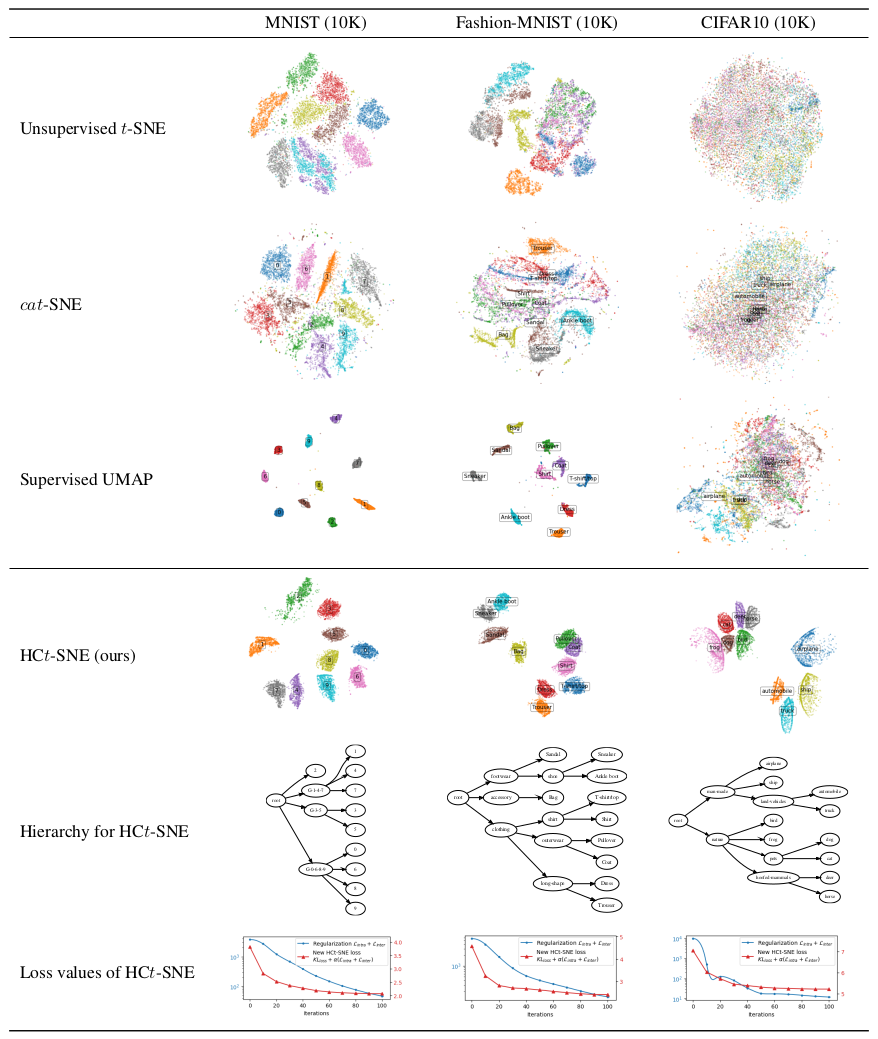
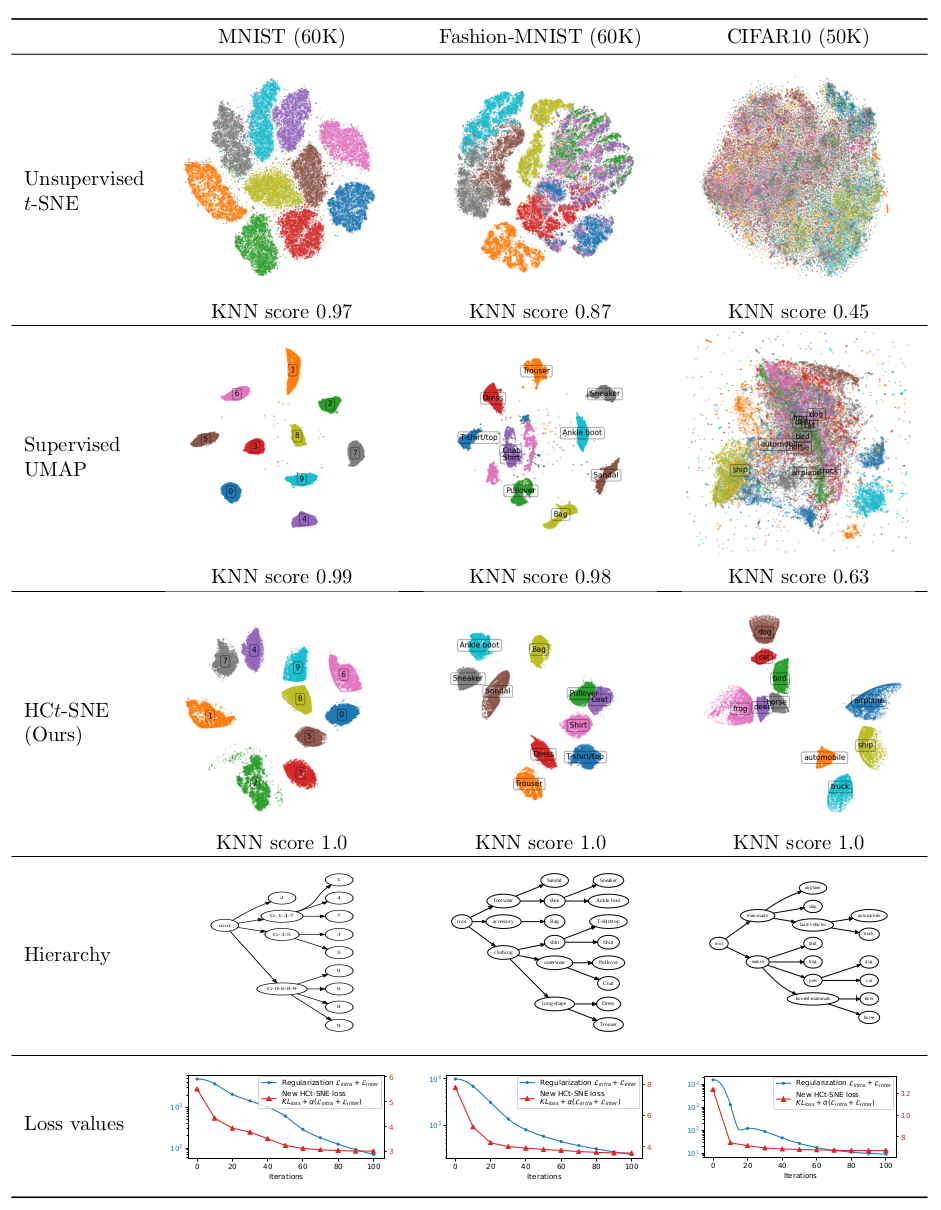
The alpha hyper-parameter for each dataset can be easily tuned by choosing the value that makes the new objective function decrease.
In the paper, alpha=7.5e-4 for MNIST and Fashion-MNIST and alpha=5e-3 for CIFAR10.
We use the full training set of each dataset (60K for MNIST, 60K for Fashion-MNIST and 50K for CIFAR10). (The test set is reserved for testing the embedding with new points -- not presented in this version). cat-SNE cannot run with the full dataset.
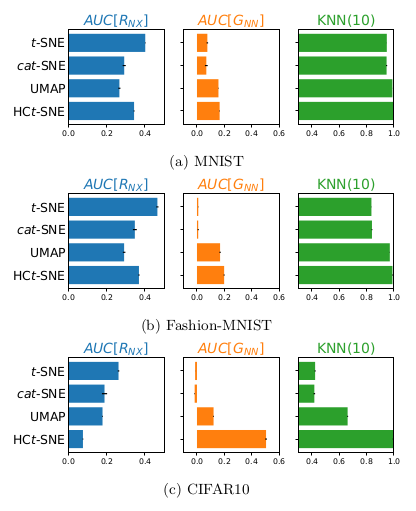
Average scores of different metrics for three datasets (on the subset of 10K data points) are shown in the following figure.
Each methods are run 10 times with different random initializations. The scores are calculated for each resulting visualizations. The mean values are reported in the bar chart, the standard deviations are shown in the black error bars. Note that the scores are stable and thus the standard deviations are small.
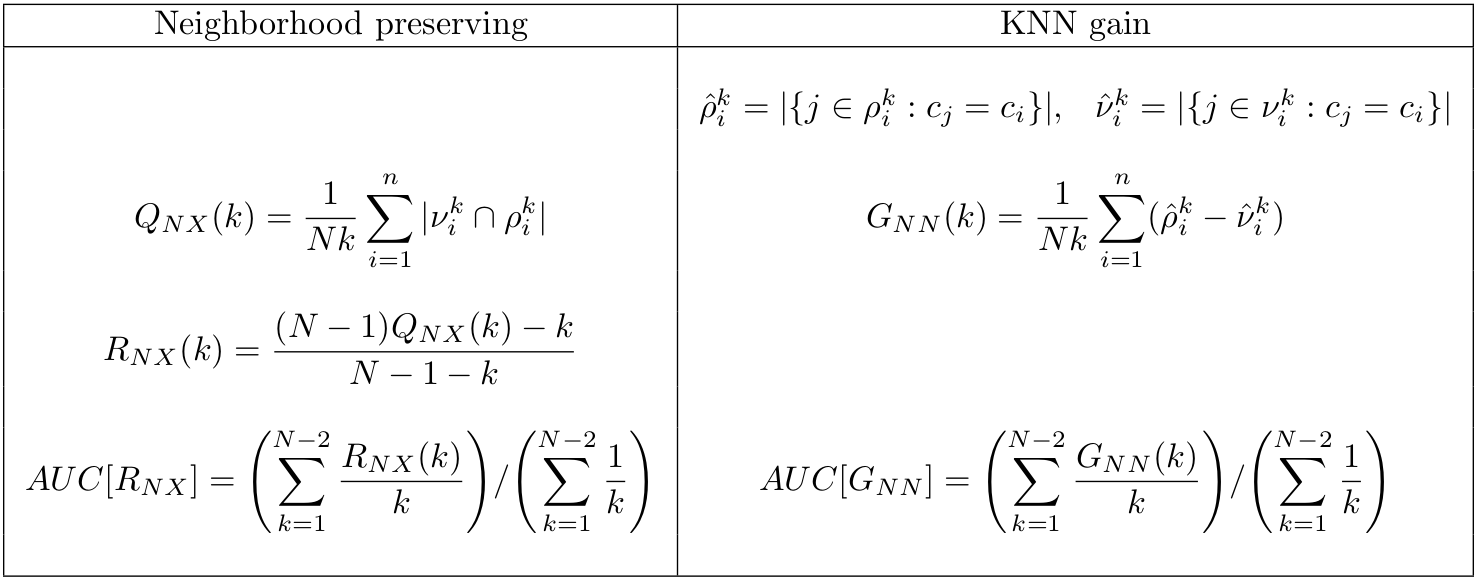
The two quality metrics AUC[R_NX] and AUC[G_NN] are detailed here:
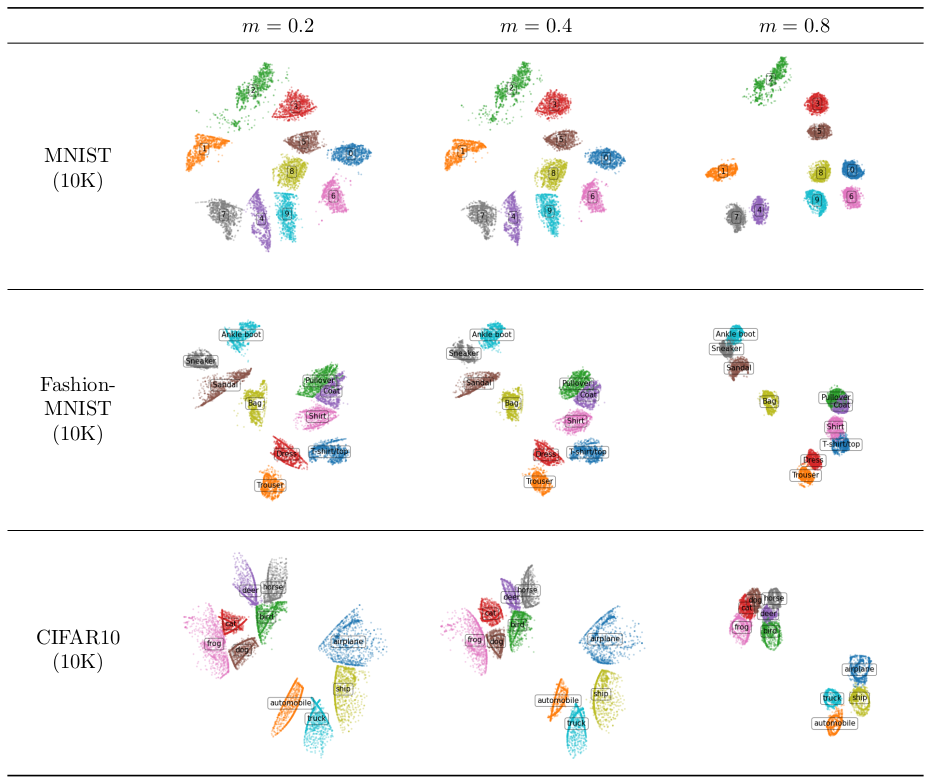
With different values of the relative margin, we obtain different visualizations. Large margin forces the groups to be more concentrated. (In the paper, we use the relative margin of 0.5.)
