PyQt5 Hypothesis Testing Visualization
This is a project created in order to demonstrate the process of hypothesis testing
Ever think hypothesis testing is difficult? What is type I error? What is type II error? And what is power?😕 Well, you are at the right place.😀
This project won't teach you the theory behind hypothesis testing. However, it will demonstrate some easy graph to help you truly understand how the hypothesis testing works.
Introduction
This application demonstrates the so-called "two tailed test". Two assupmtions are set to simplify the process
- The distribution is normally distributed
- The normal distribution has variance 1
The null hypothesis is about testing the mean of the distribution, hence, the hypothesis can be written as
Interface Introduction
To start, you have to enter three parameter
- Null Hypothesis: The mean for the null hypothesis, which is the mean that going to be tested
- True Parameter: The mean of true value, meaning that one will draw sample from this distribution(Note: In reality, this value is unknown.)
- Type I Error: The level of significance. Greater type I error indicates larger probability to reject null hypothesis even if
$H_0$ is true
Demonstration
Suppose that one wants to test the null hypothesis of
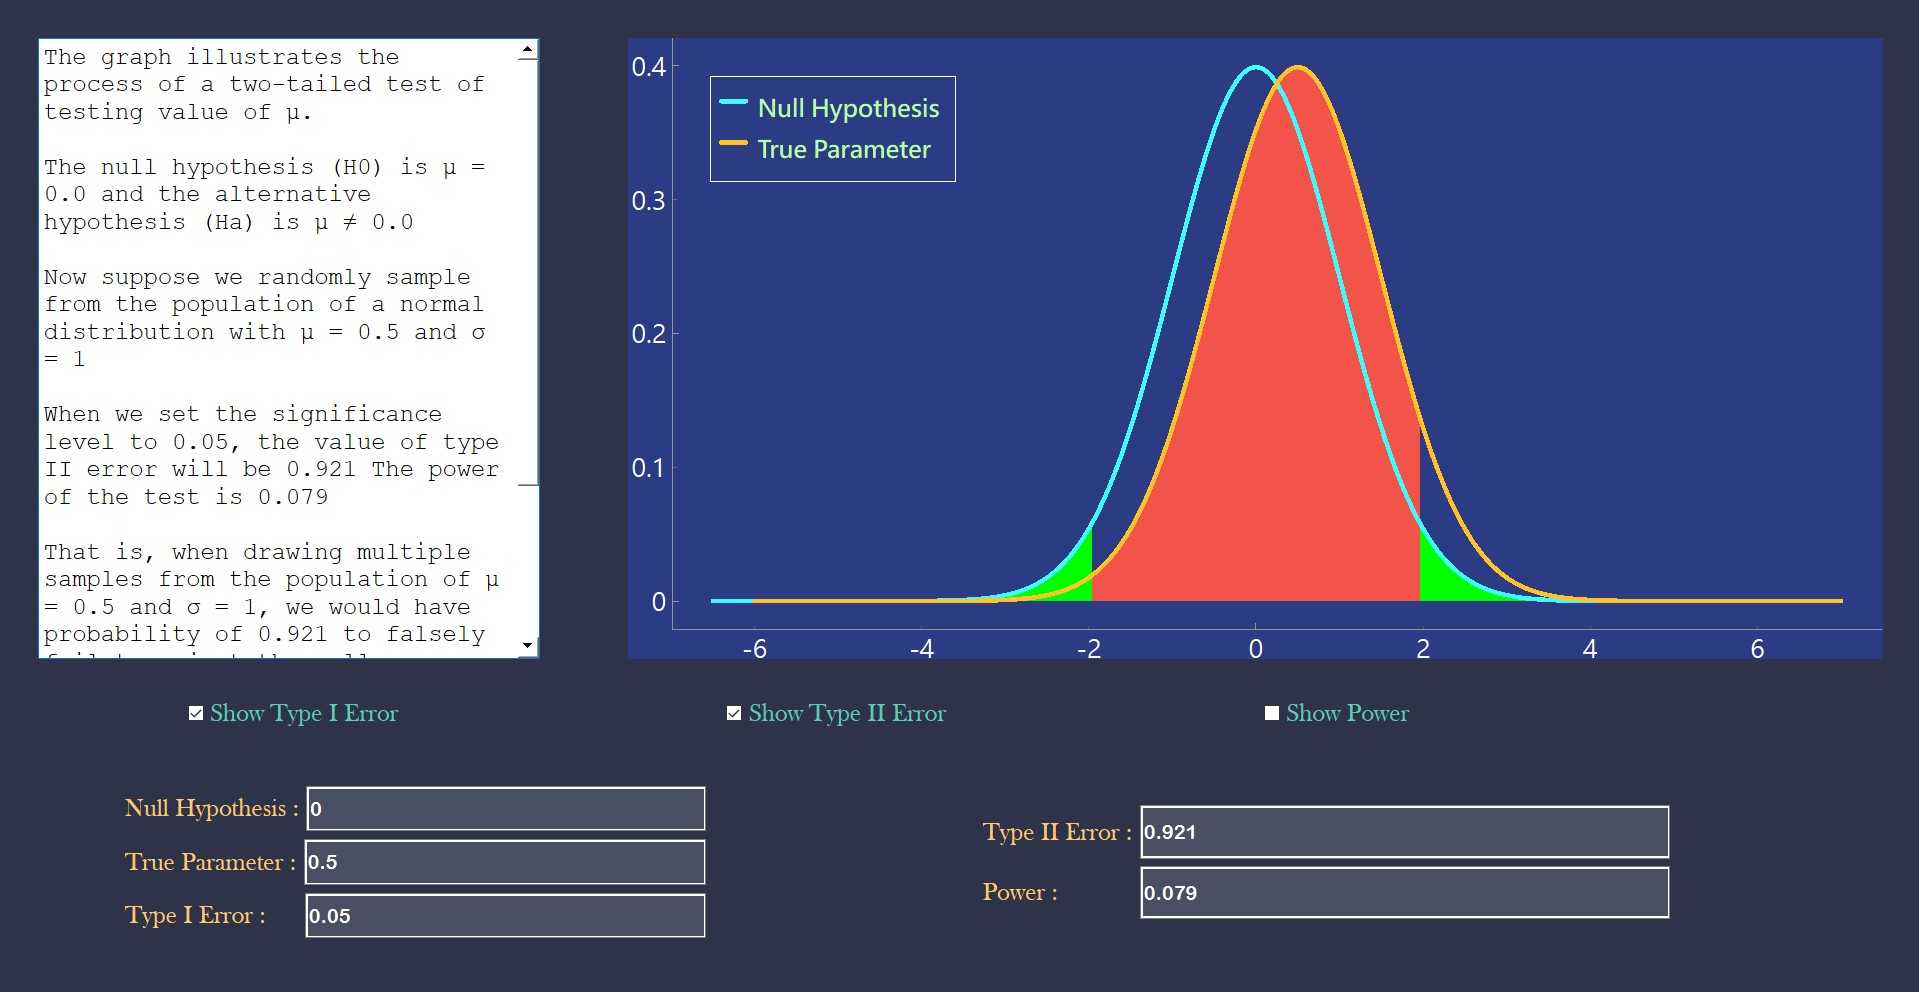
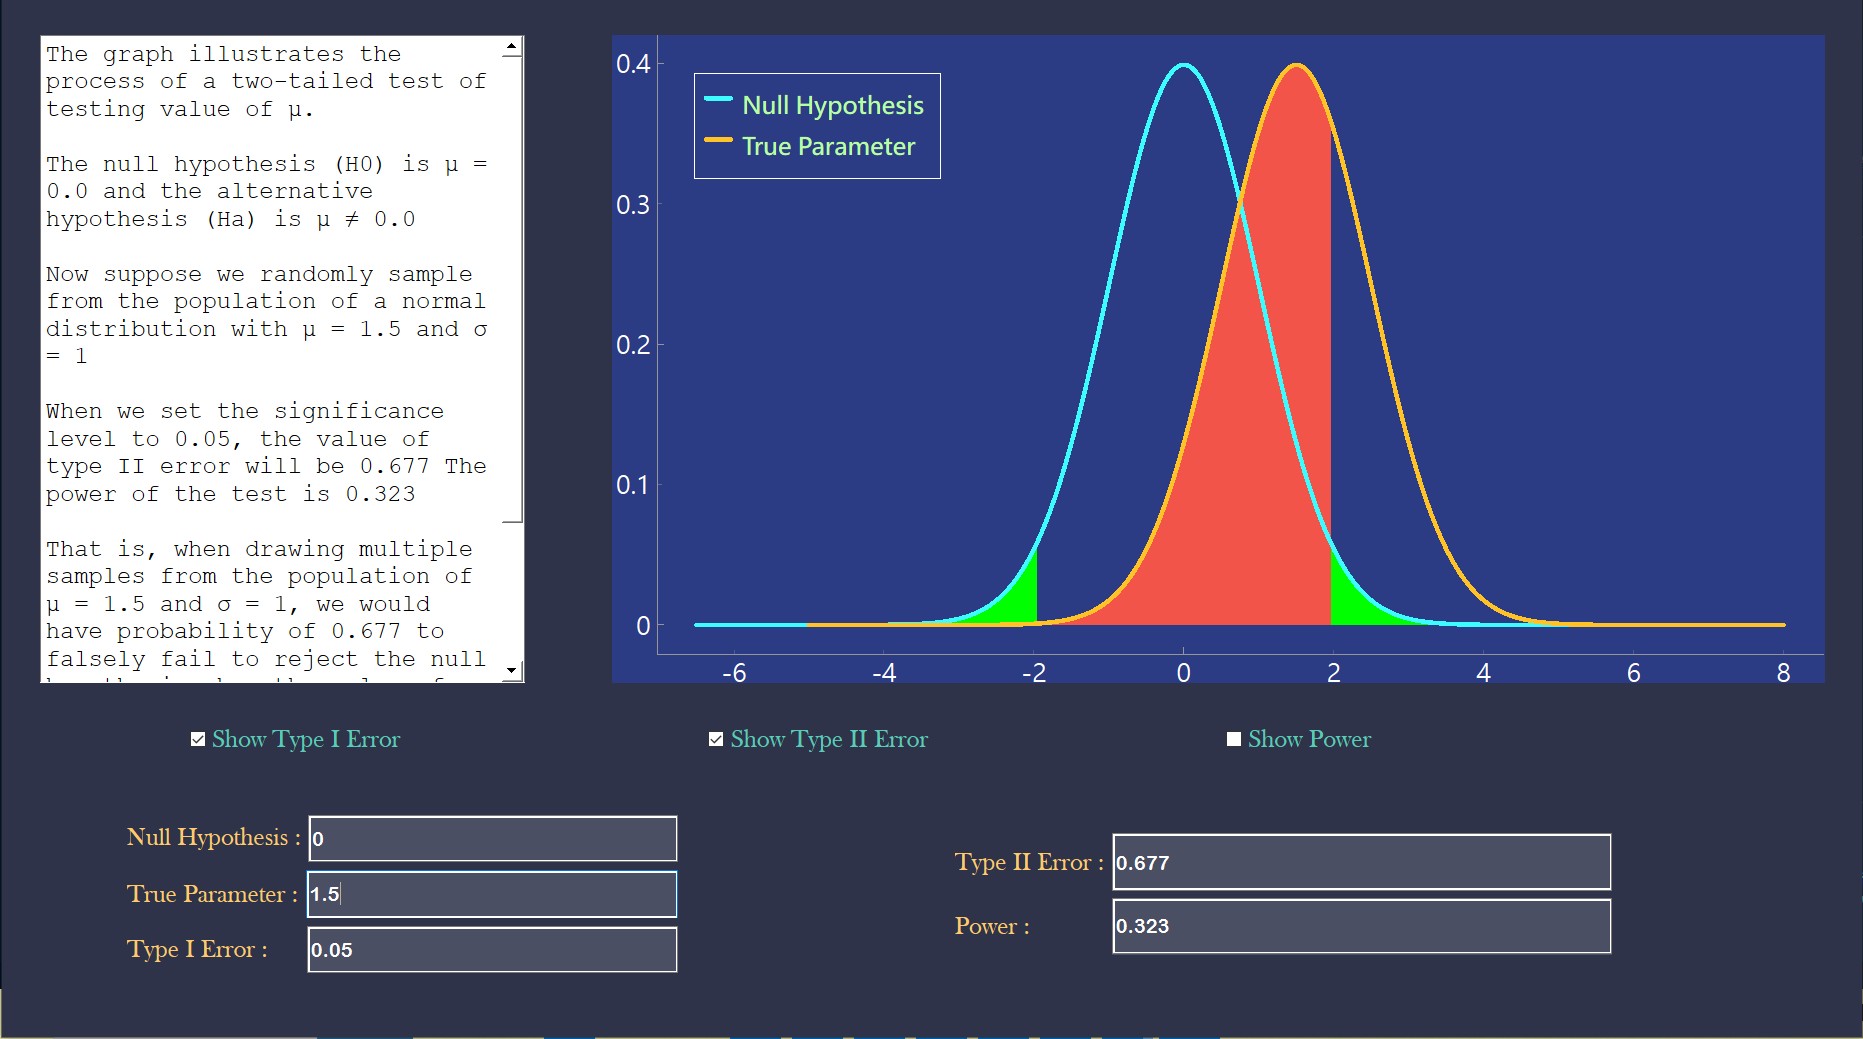
Here, as we can see, the blue line represents the normal curve of null hypothesis, and the orange line represents the normal curve of the true parameter. Also, the app will automatically calculate the value of type II error and power as shown in the picture.
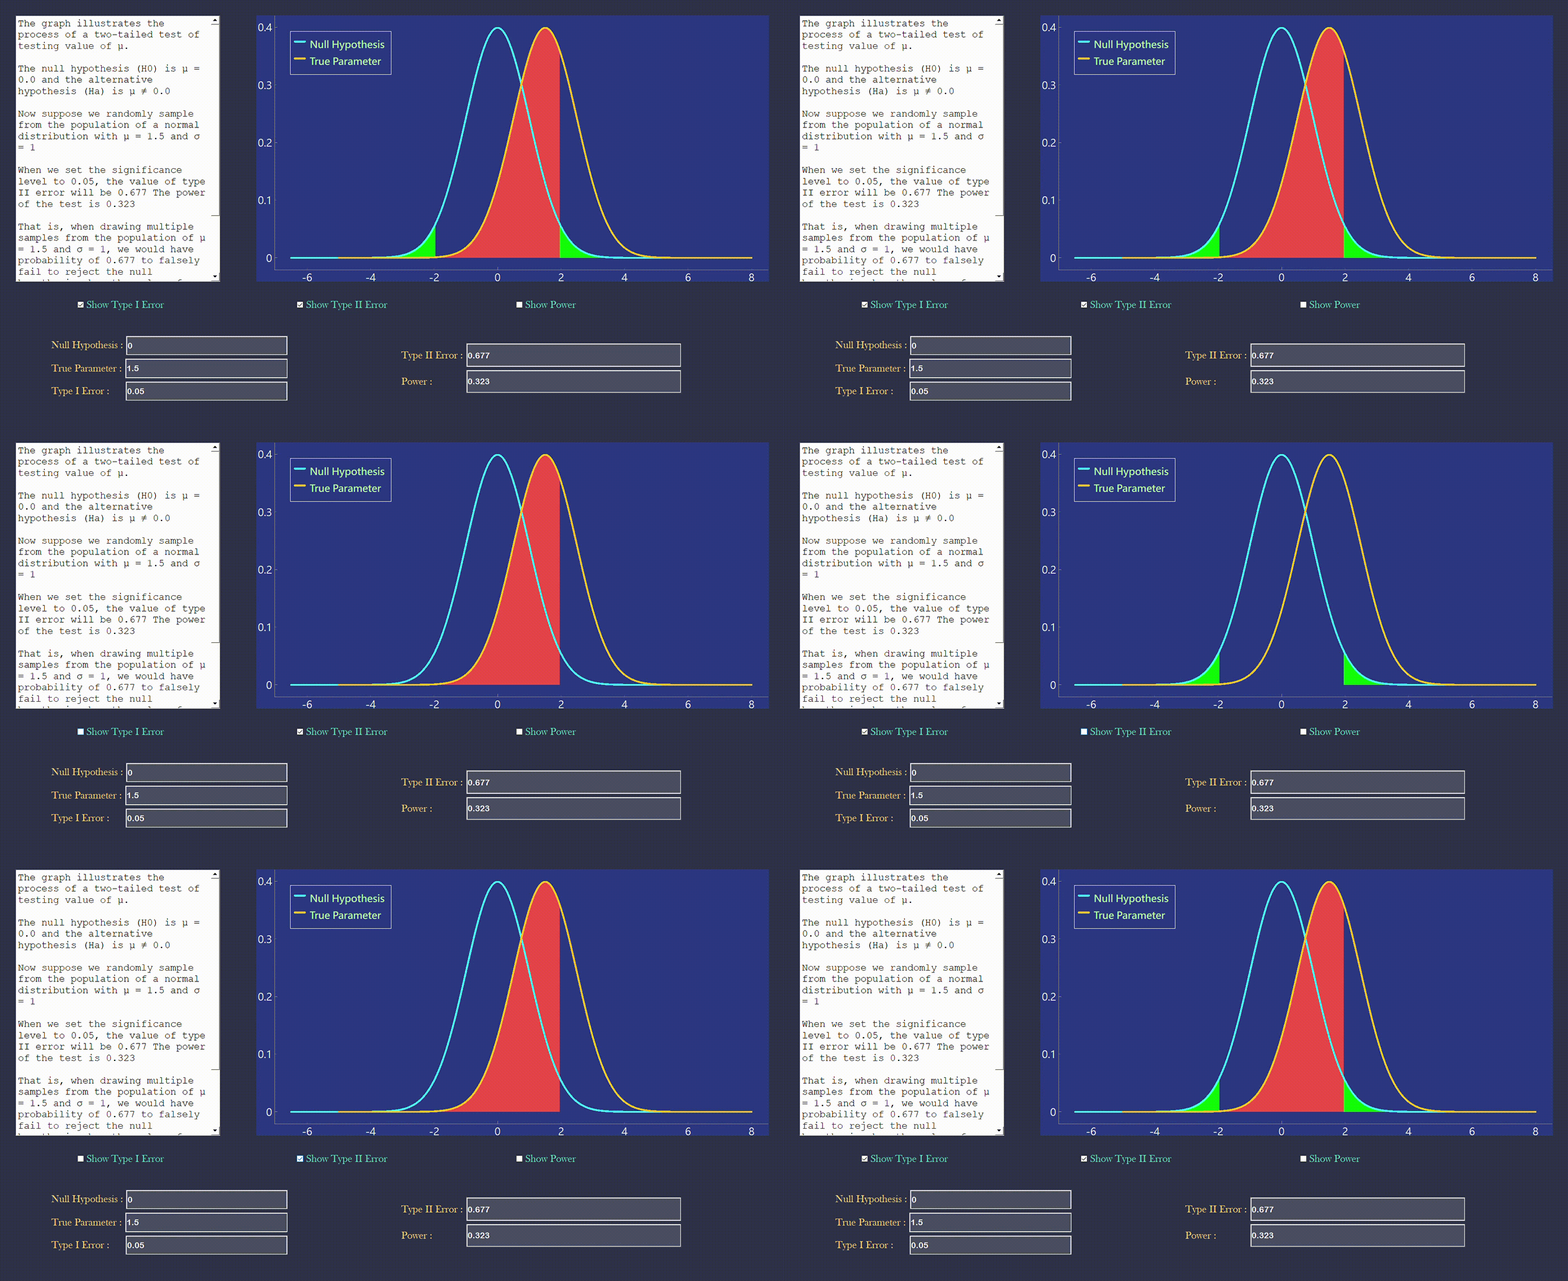
The green area represents the type I error, the red area represents the type II error. You could check and uncheck the check box to decide what areas you want to see
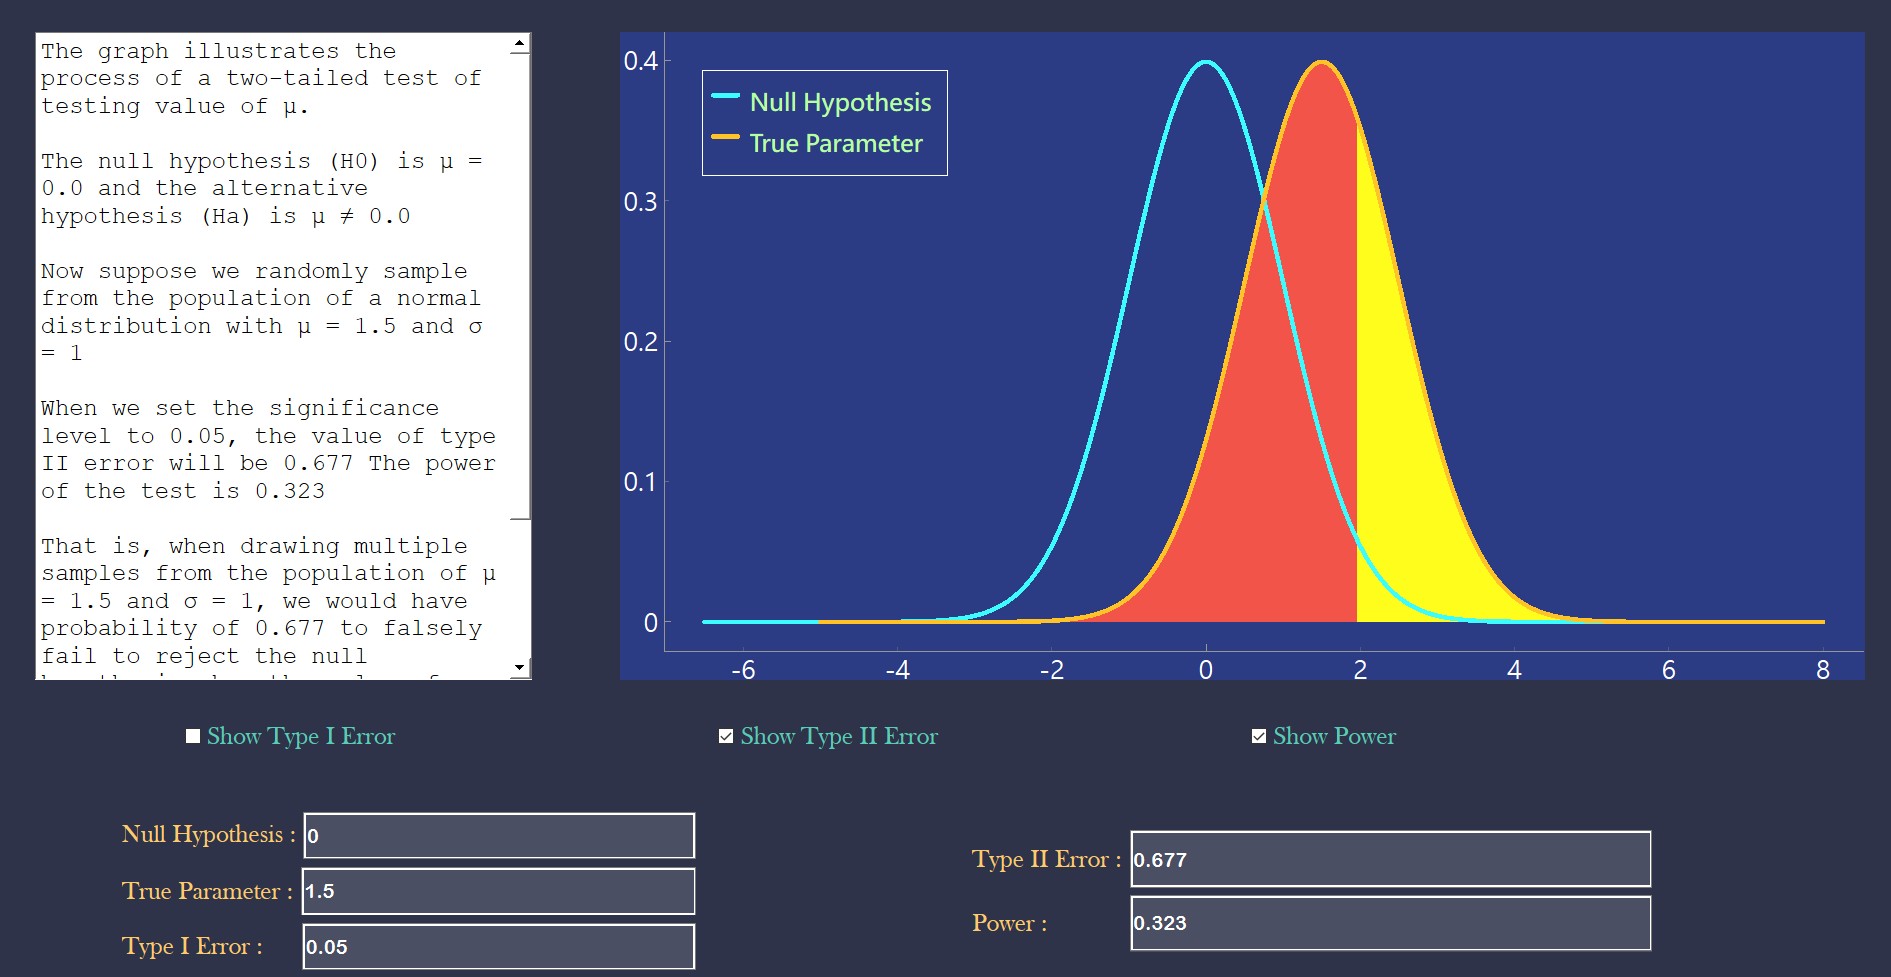
In addition, you could also check and uncheck the check box of power to see the area which power represents
The yellow area represents the power
To see a full explanation of each number in the application and its statistical meaning, you could refer to the text area on the left. The text area provides complete explanation of the meaning of the parameters which help you to better understand hypothesis testing.
That's all for this project, hope that this app can help you better understand the hypothesis testing.
If you want to try on the application youself, please click HERE to download the EXE file that could easily run on your computer.


