The Web App link is here: https://wenbin-billy-zhao.github.io/D3JS-Plot-with-Animated-Transitions/index.html
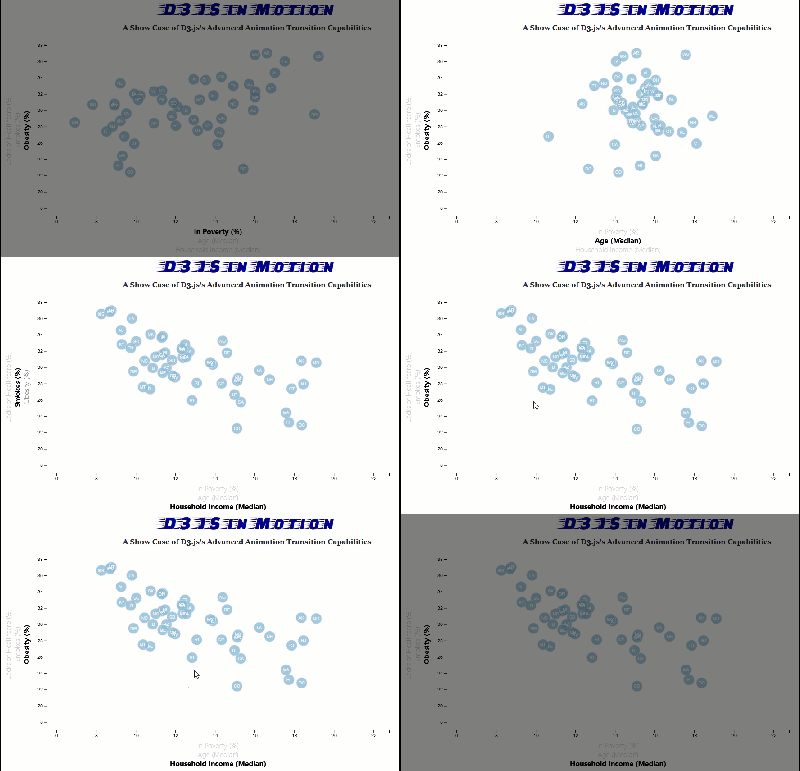
This is a scatter plot with multiple dimensions, by clicking on different dimensions result dynamically updated transition of data
Using D3.csv import data, then use javascript type cast and manipulate data set
Add proper transitions for X/Y axis calculations based on screen size of the view port
The D3 transition properties calcualte new X/Y cordinates of the scatter bubbles and transition them properly.
Enjoy!
