- Eric Tonian
- Godwin Assiogbon
- Aydin Yildirim
- Trevor Kulbeth
- Agustin Gonzalez
- Wenbin Zhao "Billy"
This project will examine the relationship between property values and racial demographics in the zip codes areas of Austin, TX from 2011-2017.
* H-Null: If property values rise within Austin (by zip code area), then there will be no changes of the diversity index*.
* H-Alt: If property values rise within Austin (by zip code area), then the diversity index* will show significant negative changes.
- Does the diversity negatively impacted by the raise of home value in Austin?
- What is Austin's geographical layout like in relation to home value and diversity?
- Is there any specific locations that diversity and home value show strong correlations?
- Zillow Home Value Index (ZHVI) for All Homes - Time Series, 1996-2018 (https://www.zillow.com/research/data/)
- U.S. Census American Community Survey (ACS), 2011-2017 (https://factfinder.census.gov/faces/nav/jsf/pages/index.xhtml)
- GreatSchools API (https://www.greatschools.org/api/docs/technical-overview/)
- Diversity Index - The 'Diversity Index' is a value between 0 and 1 which represents the probability of two people being of a different race if randomly picked from the same sample.
- Period
- Home Value
- Zip data (for geo location and map)
- Pandas DataFrame for ETL
- Matplotlib, Follium, Google Map API for Visualization
- Python LXML/XML parsing for GreatSchools.org API
Merging the data in one uniform dataset
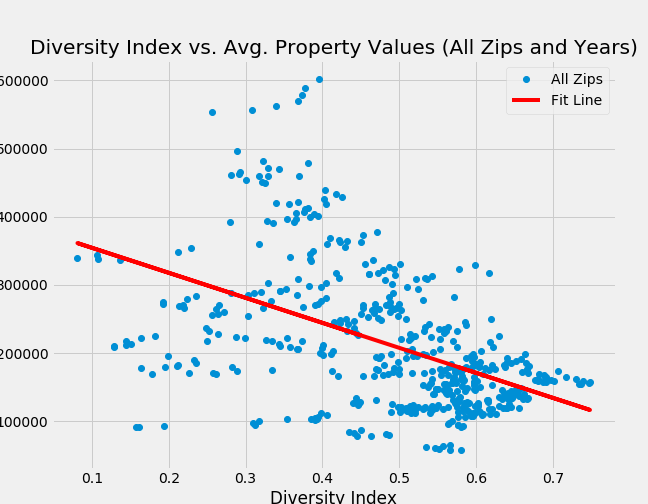
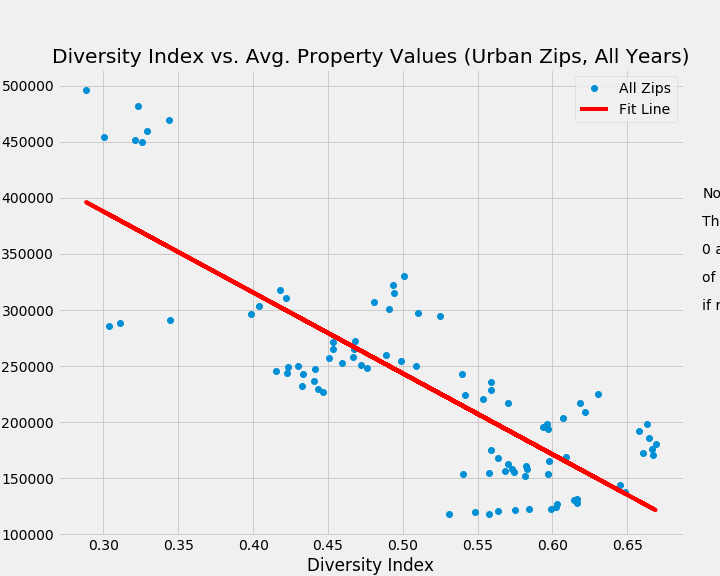
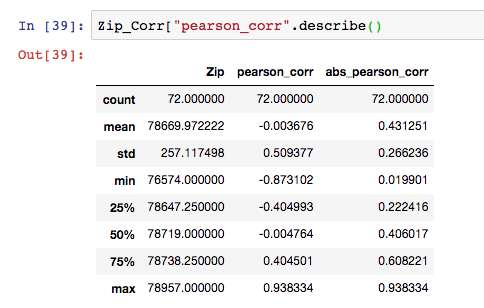
Scatter Plot showing weak correlation
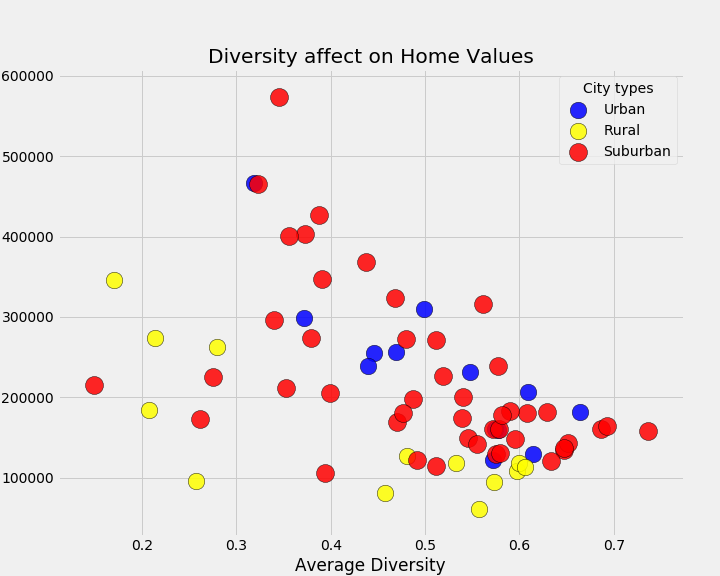
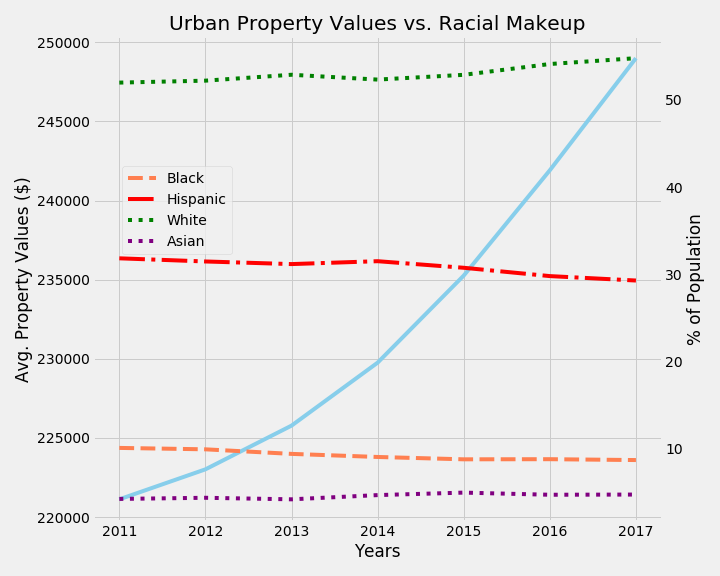
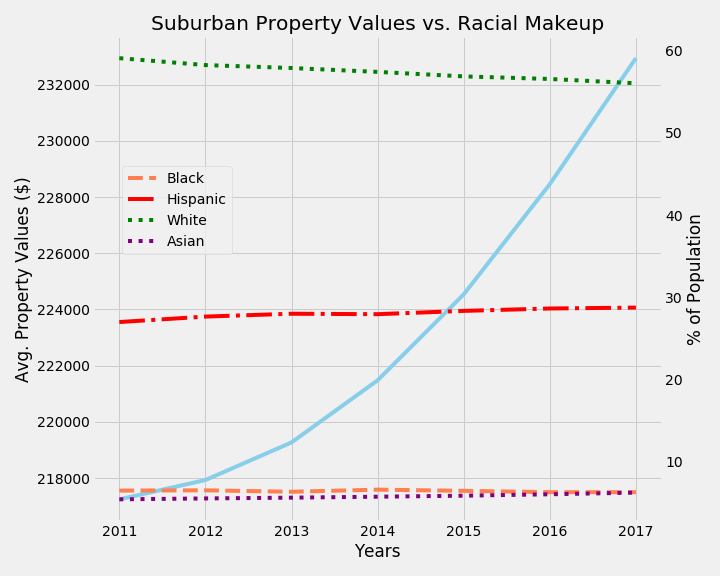
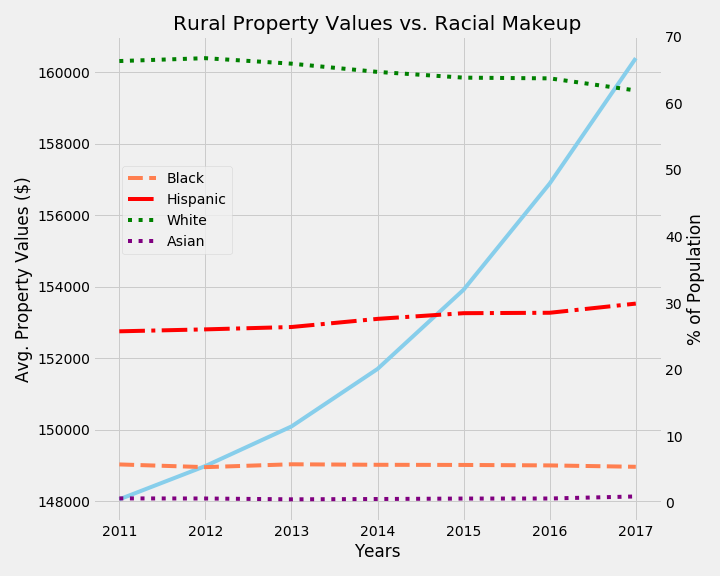
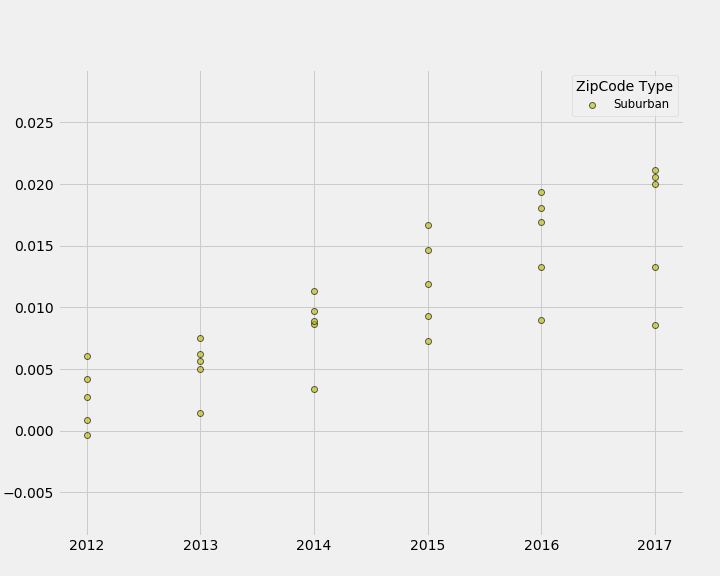
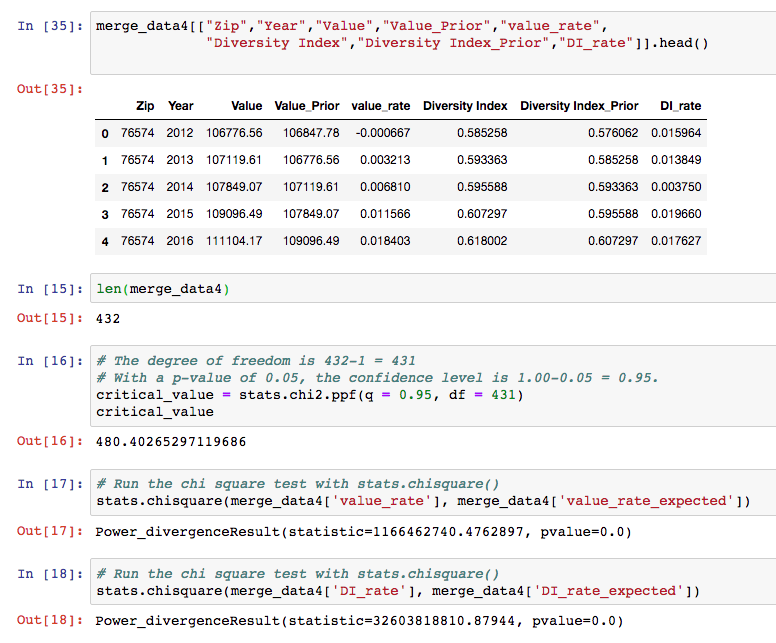
Since the p-value indicate that the p-value is less than .05, it rejects the null hypothesis and support our hypothesis that there is a big correlation between property value and diversity. I took it further and went into how it affects different city types and from the looks of it, it seems like rural areas takes the most hit when it comes to how diversity index affects the property value but overall, it indicates that as diversity index increases, property value across all city types decreases.
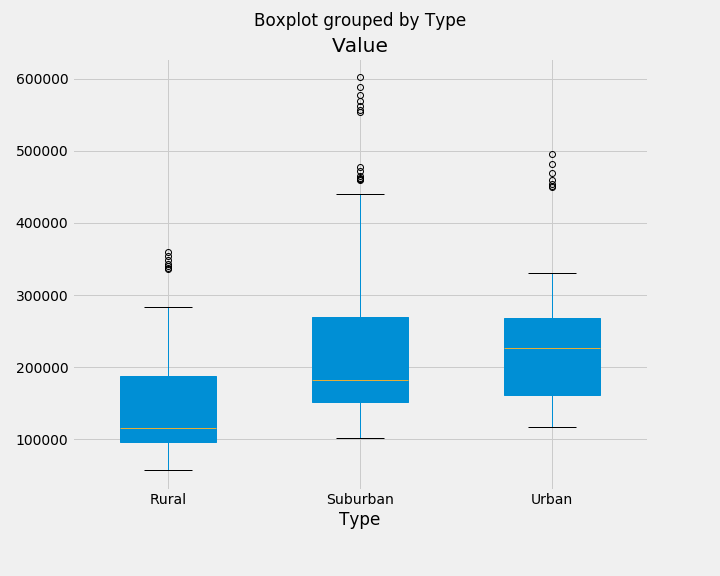
slope: -366763.29582571954 intercept: 391067.6471445414 stderr: 29170.424325240187 r-value: -0.48937718437748057 p-value: 1.0384045132848702e-31
slope: -721519.9070789743 intercept: 604243.1975286676 stderr: 55372.521800578215 r-value: -0.8099936377599409 p-value: 2.4371772271053096e-22
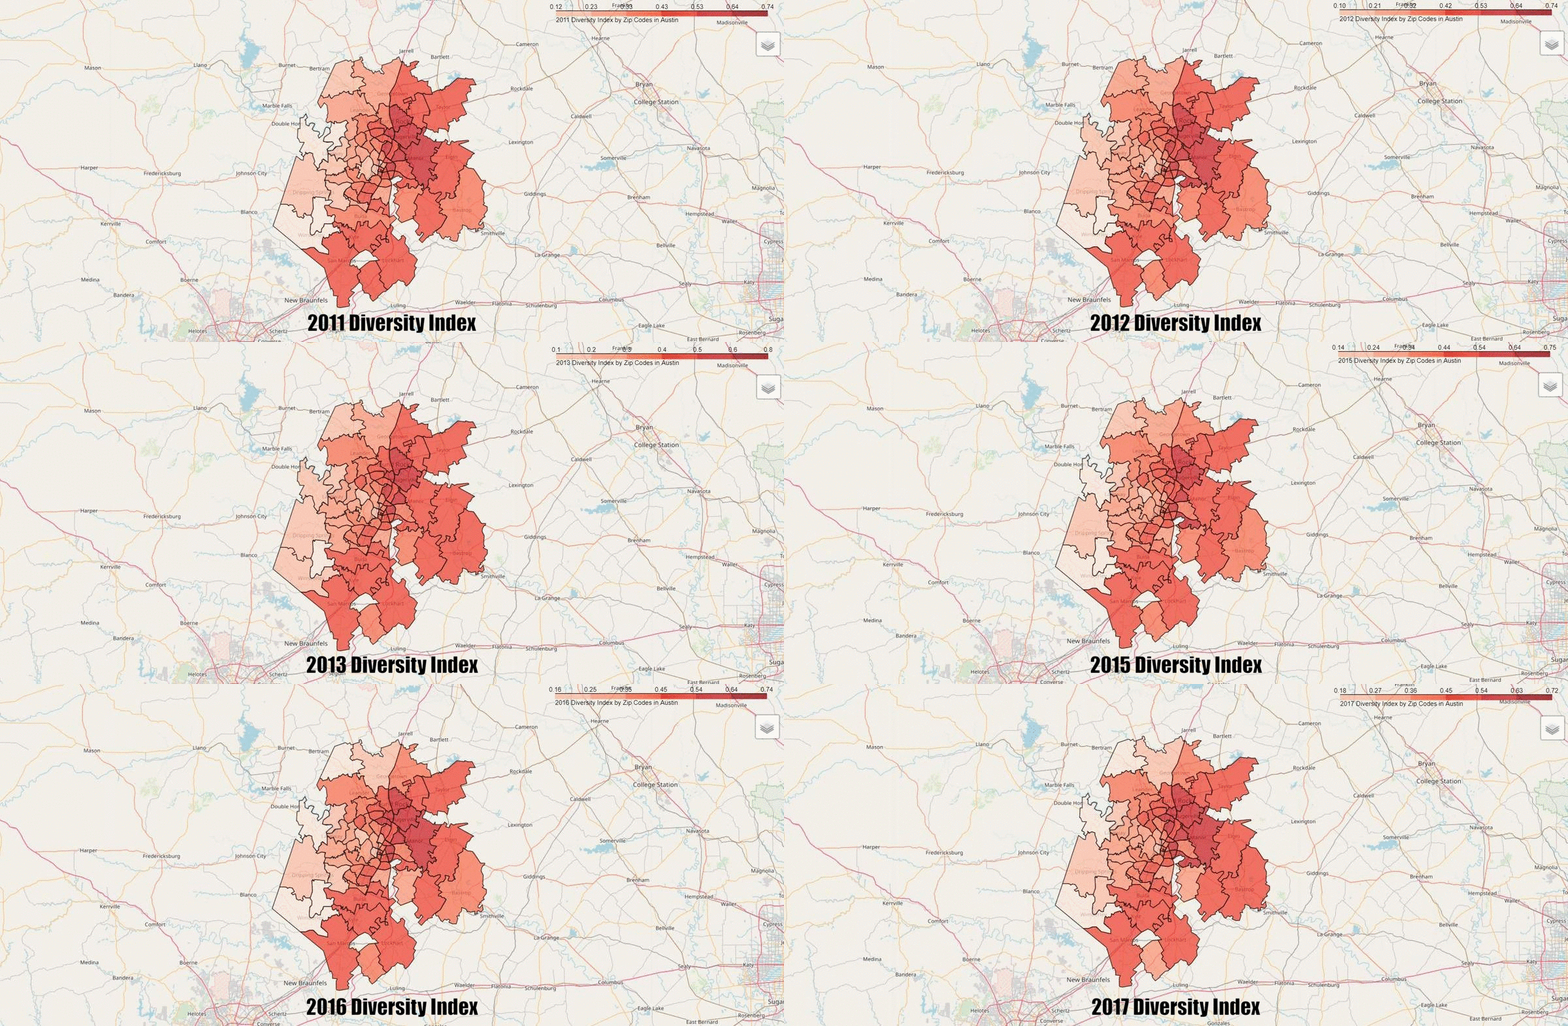
For the heat map, I used the merged data from Zillow and Census .I filtered merged data by 2017 to understand how diverse is Austin and surrounding areas.I added latitude and longitude to my data chart as well to use heatmap. In short, Round Rock, Pflugerville, Leander, Buda, Mountain City, San Marcos and part of the Cedar Park have diverse population compare to rest of the Austin and surrounding areas.
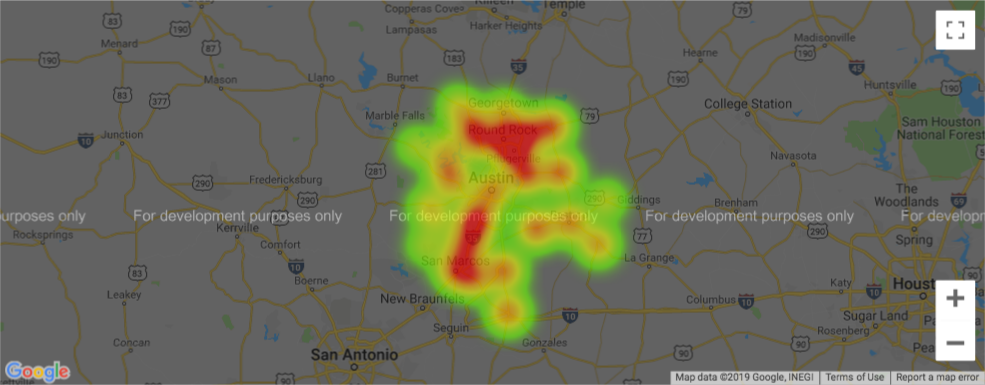
https://www.dropbox.com/sh/z98ulxf2m9khuku/AAC7XHnB_WOKv-ca9jviqOS6a?dl=0
Let's take a look at the data.
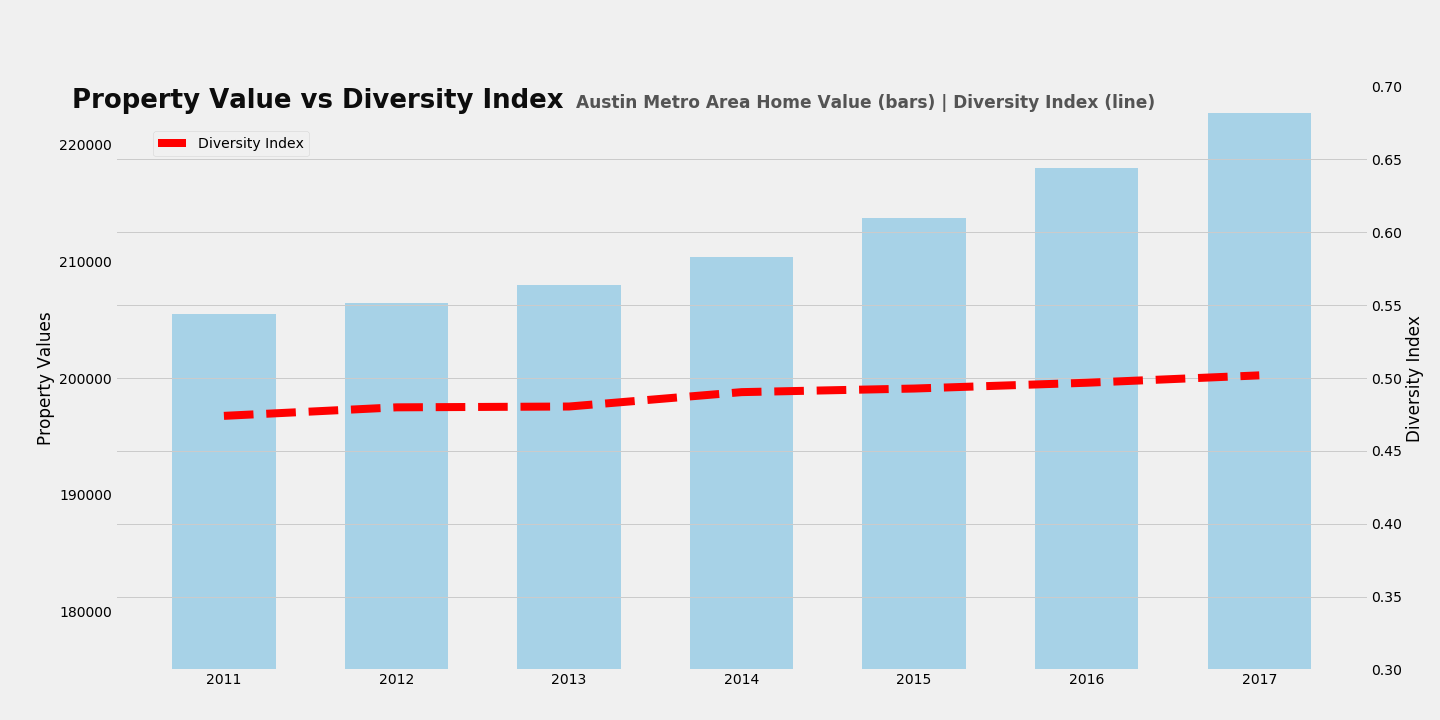
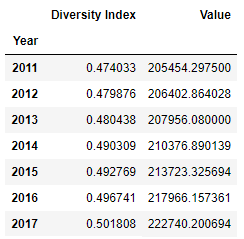
Austin as a whole (including all zip code) shows a slightly uptick of diversity index:
What if we look closer - just the area that immediately east of downtown by I-35?
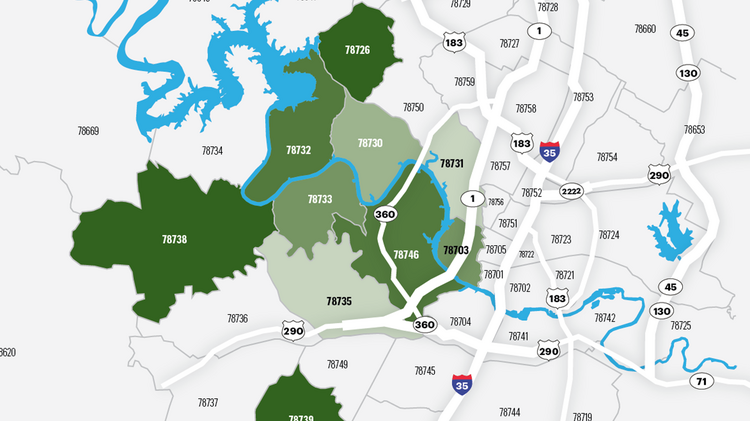
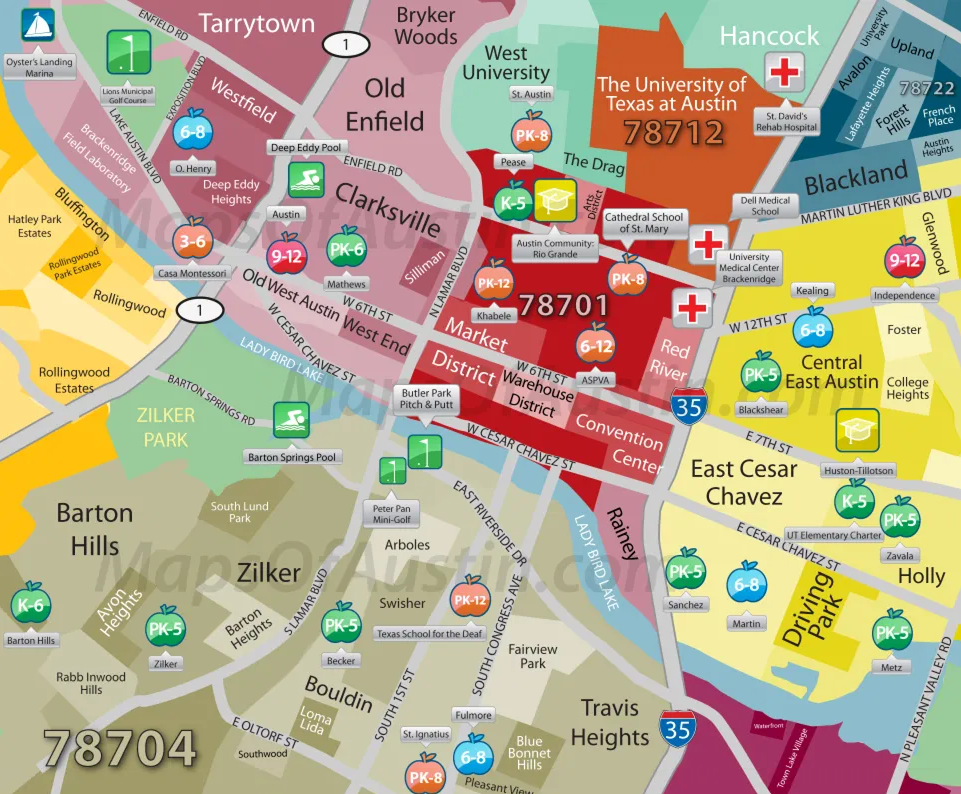
I included 7 zip codes. Here is the map showing the zip codes selected:
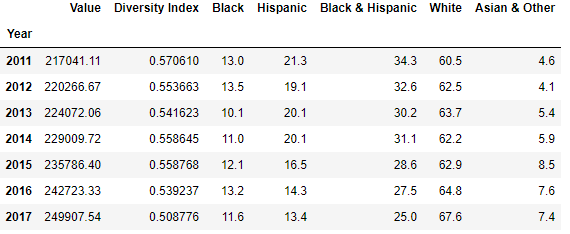
Now, let's take a look at the data set:

Interesting, isn't it? These area shown quite a bit of movement among different ethic groups:
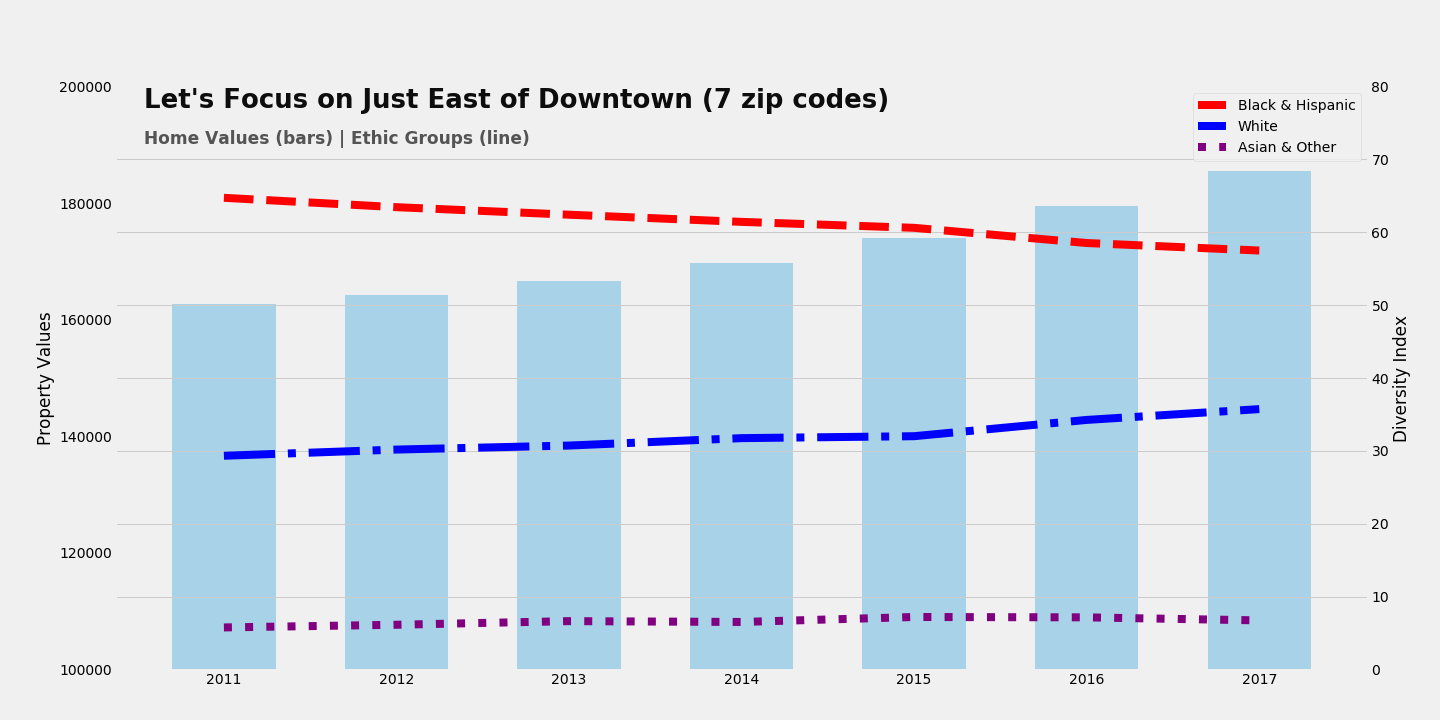
Now, let's look further in granuality. Just one zip code: 78722
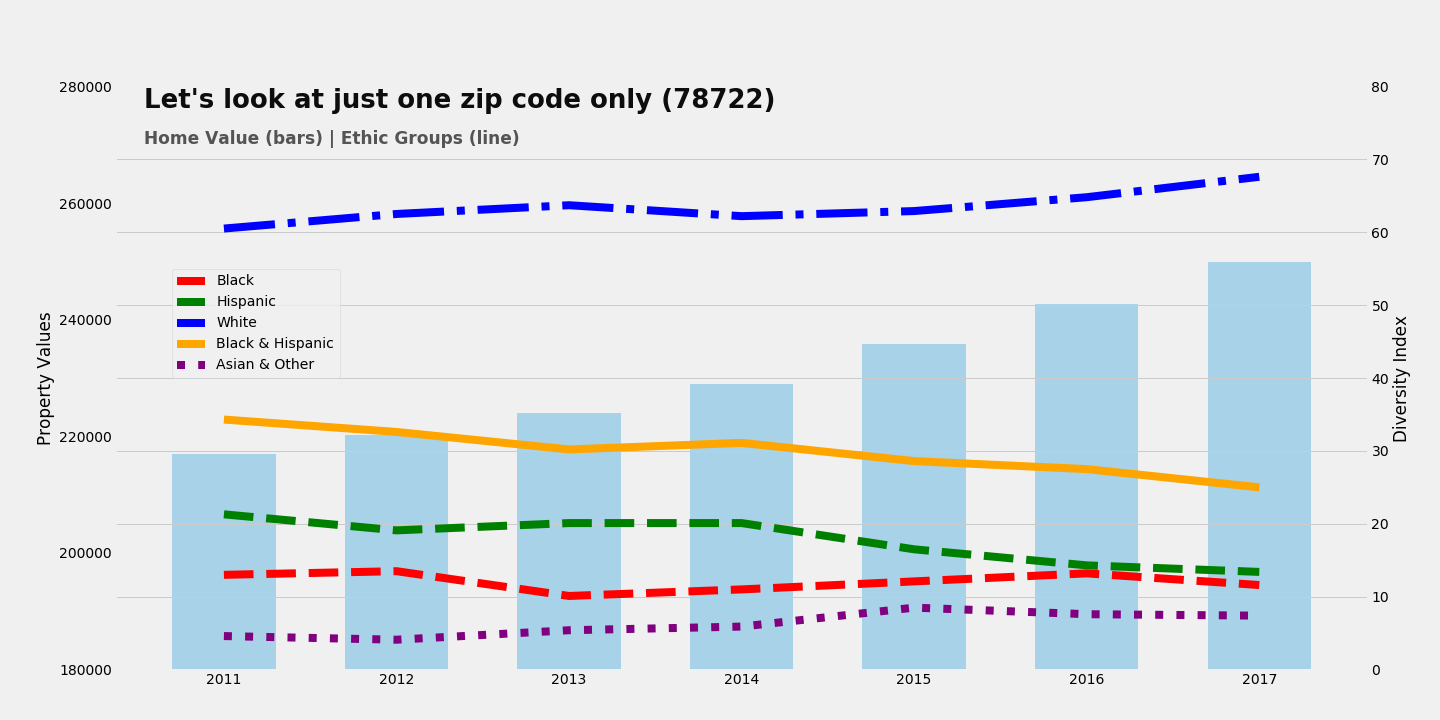
What about 78722?
Let's take a look at the data first:
The graph and T test will show much more distinctive pattern than Austin in gernal:
LinregressResult(slope=-3720.172417840378, intercept=342491.2738648559, rvalue=-0.9688170714695908, pvalue=0.0003243039756793674, stderr=425.4978954053012)
- Austin as a whole, we do see a weak correlation between raising property values and falling diversity rates
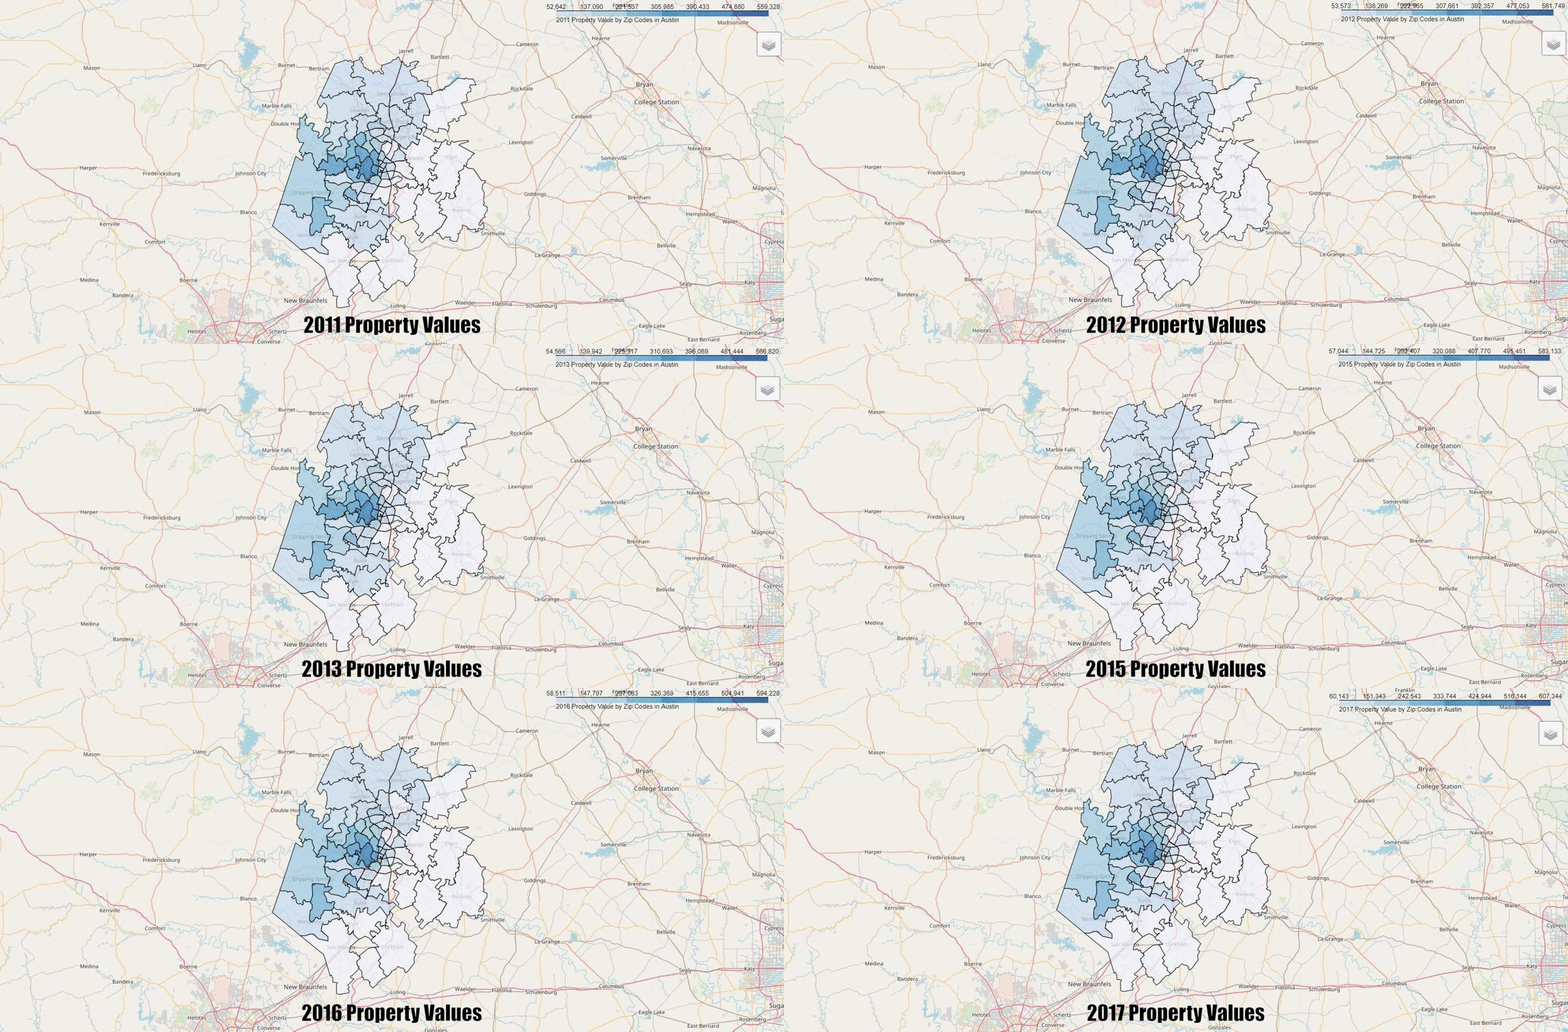
- Austin's wealth (home value) tend to concentrated to the west while eastern areas of Austin tend to be more diverse
- When look at different areas such as certain zip codes, we see a much more pronounced pattern of home value increase cause shift of diversity to reduce.
- More specifically, certain central east Austin communities see a major change in ethic and racial composition change.
- Data source
- Further discussions


