Grafana is an open source solution for running data analytics, pulling up metrics that make sense of the massive amount of data & to monitor our apps with the help of cool customizable dashboards.
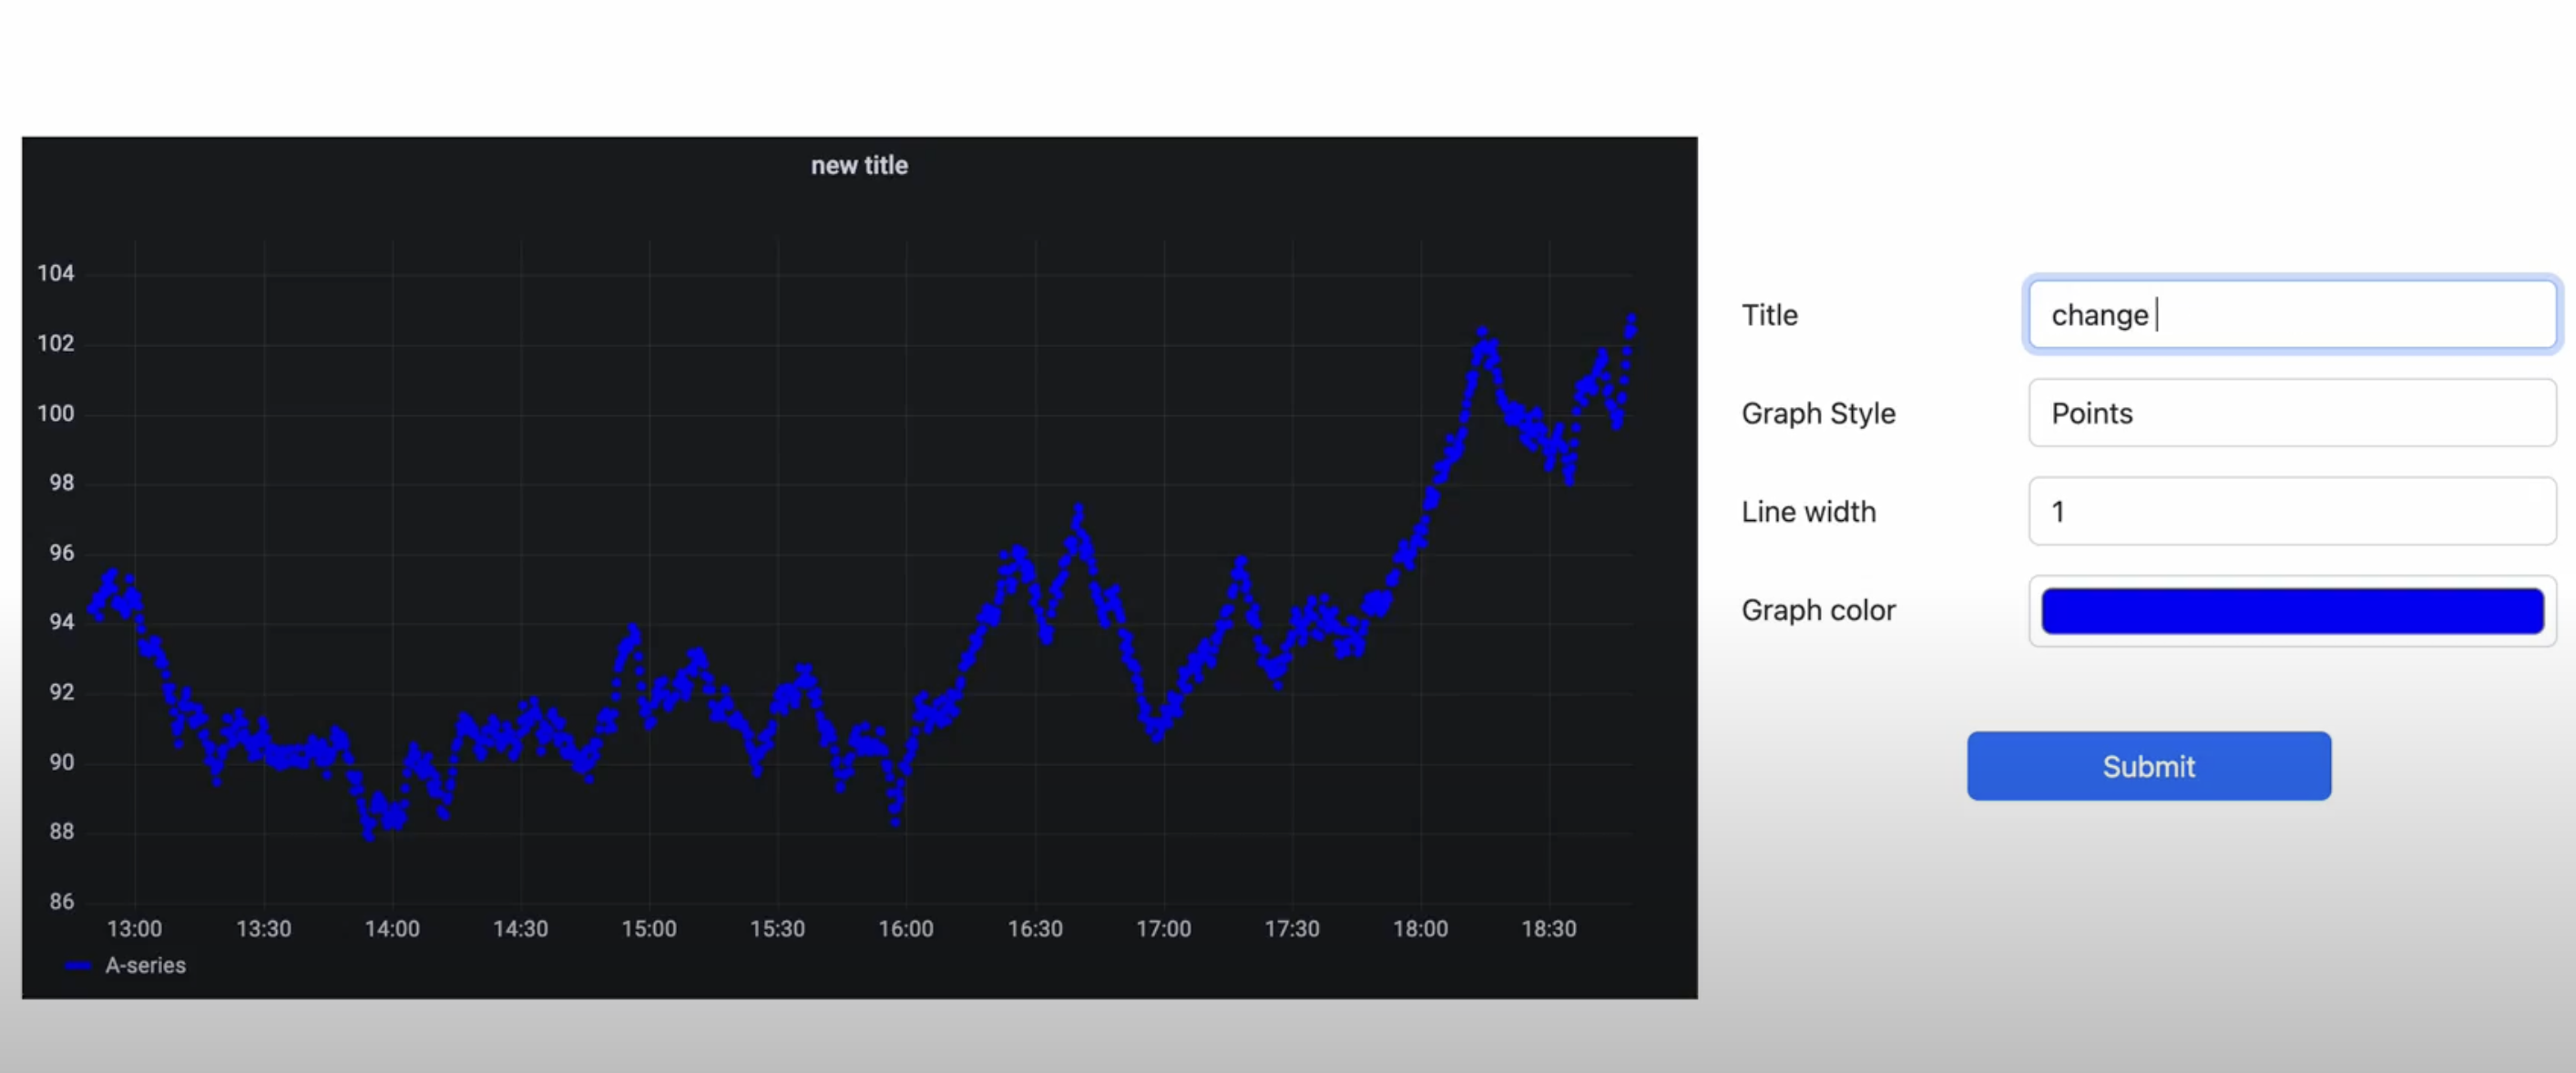
This app gives demonstrates how we can embed a grafana panel into our node app and display it on our webpage as well as edit the properties of the grafana chart. This app is built using NodeJS, ExpressJS and EJS templating engine.
- Clone the github repo
- Run
npm iand it will install all the project dependencies
- Go to Grafana Installation Guide and install grafana.
- After completing the installation, you should be able to open grafana by going to
http:\\localhost:3000from your browser. - From the sidemenu, select
Configuration->API Keyand generate a new API key withAdminrole. Paste this key inside yourenvfile
- Select the
Createoption from sidemenu and selectDashboard, now selectAdd a new panel. You'll see grafana creates a panel for you with some dummy data. We're going to embed this panel in our node app - Click on the
Savebutton from the menu bar and enter a name for your dashboard and save it. - Click on the panel title ->
Share->Embed-> Copy the value of src attribute from theiframeelement and paste it in theenvfile
- Now, to give permission to access grafana dashboard from our node server, we need to change some configurations. Checkout Grafana Configuration Guide to locate the
grafana.iniconfig file in your OS and open it using any text editor. - Search for
allow_embeddingkey and change its value totrue. Also remove the semicolon;before the key name to uncomment it - This property allows us to embed our panel into other webpages. - Now, search for
anonymouskeyword and insideauth.anonymoussection, remove the semicolon before property name and set theenabledproperty totrue. This now allows us to access the panel without need to login to grafana. - You can confirm these changes by going to
http://localhost:3000/admin/settingsand checking the property values
- Run
npm run devto start the node server and go tohttp:\\localhost:4000to see the embedded panel - You can also change the panel properties by going to
\editroute
Please feel free to reach out to me at yashsolanki1709@gmail.com in case you have any queries.
