
In this assignment, you will build an interactive dashboard to explore the Belly Button Biodiversity DataSet.
-
Create a new repository for this project called
plotly-challenge. Do not add this homework to an existing repository. -
Clone the new repository to your computer.
-
Inside your local git repository, create a directory for the Plotly challenge. Use the folder name to correspond to the challenge: Belly_Button_Diversity.
-
This is a full stack app so add your html, js, css, python and sqlite files.
-
Push the above changes to GitHub or GitLab.
Use Plotly.js to build interactive charts for your dashboard.
-
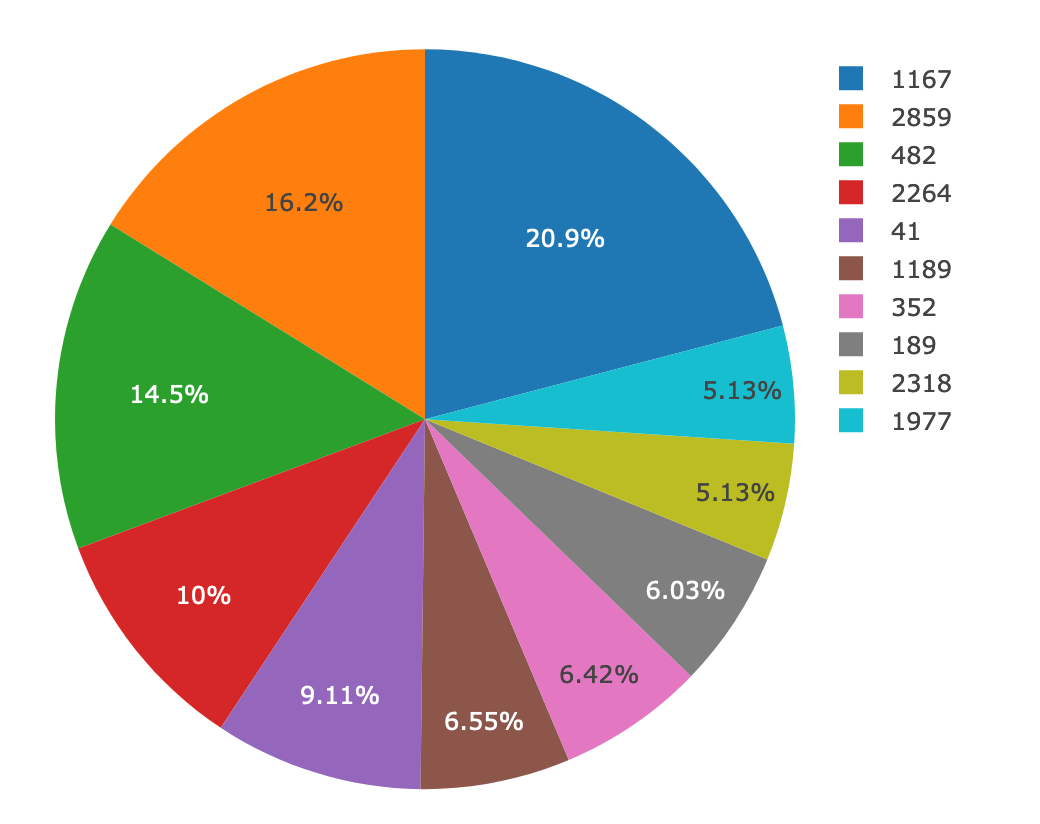
Create a PIE chart that uses data from your samples route (
/samples/<sample>) to display the top 10 samples.-
Use
sample_valuesas the values for the PIE chart. -
Use
otu_idsas the labels for the pie chart. -
Use
otu_labelsas the hovertext for the chart.
-
-
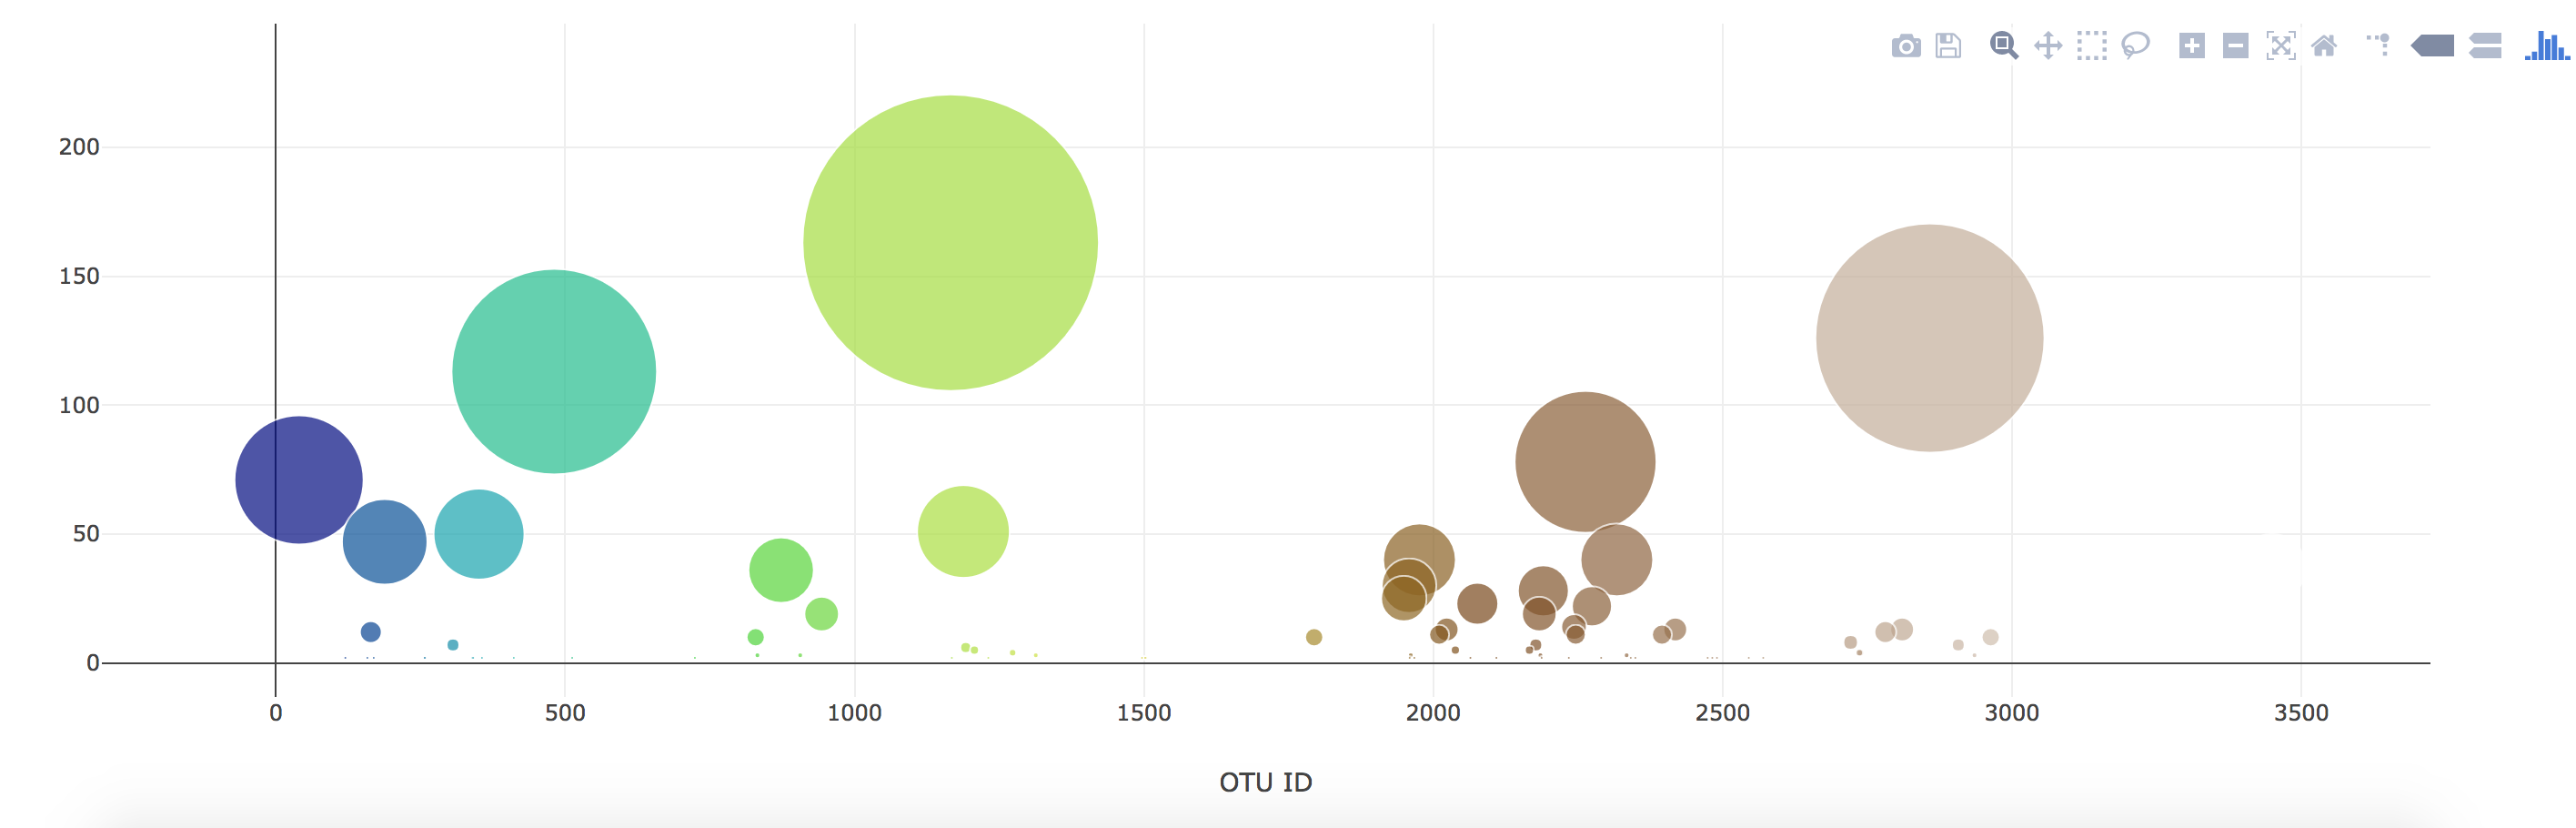
Create a Bubble Chart that uses data from your samples route (
/samples/<sample>) to display each sample.-
Use
otu_idsfor the x values. -
Use
sample_valuesfor the y values. -
Use
sample_valuesfor the marker size. -
Use
otu_idsfor the marker colors. -
Use
otu_labelsfor the text values.
-
-
Display the sample metadata from the route
/metadata/<sample>- Display each key/value pair from the metadata JSON object somewhere on the page.
-
Update all of the plots any time that a new sample is selected.
-
You are welcome to create any layout that you would like for your dashboard. An example dashboard page might look something like the following.


Deploy your Flask app to Heroku.
-
You can use the provided sqlite file for the database.
-
Ask your Instructor and TAs for help!
The following task is completely optional and is very advanced.
-
Adapt the Gauge Chart from https://plot.ly/javascript/gauge-charts/ to plot the Weekly Washing Frequency obtained from the
/metadata/<sample>route. -
You will need to modify the example gauge code to account for values ranging from 0 - 9.
-
Update the chart whenever a new sample is selected.

Use Flask API starter code to serve the data needed for your plots.
- Test your routes by visiting each one in the browser.
-
Don't forget to
pip install -r requirements.txtbefore you start your server. -
Use
console.loginside of your JavaScript code to see what your data looks like at each step. -
Refer to the Plotly.js Documentation when building the plots.
Trilogy Education Services © 2019. All Rights Reserved.