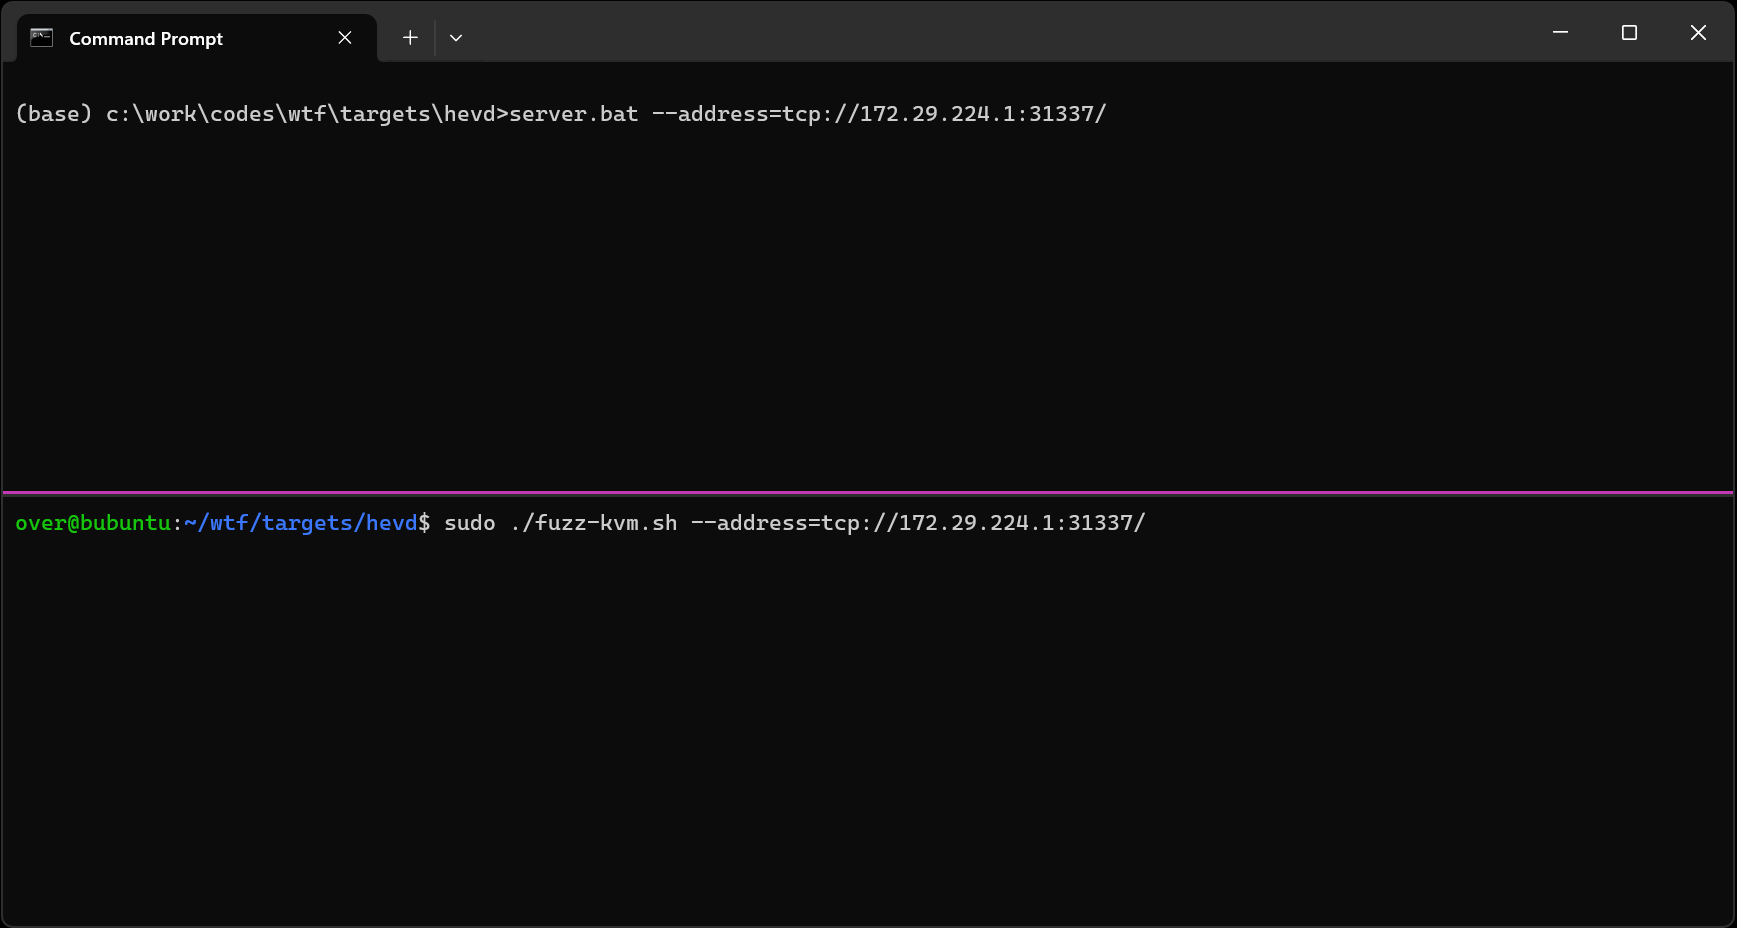
A distributed, code-coverage guided, cross-platform snapshot-based fuzzer designed for attacking user and or kernel-mode targets running on Microsoft Windows and Linux user-mode (experimental!).
what the fuzz or wtf is a distributed, code-coverage guided, customizable, cross-platform snapshot-based fuzzer designed for attacking user and or kernel-mode targets running on Microsoft Windows or Linux (experimental, see linux_mode). Execution of the target can be done inside an emulator with bochscpu (slowest, most precise), inside a Windows VM with the Windows Hypervisor Platform APIs or inside a Linux VM with the KVM APIs (fastest).
It uncovered memory corruption vulnerabilities in a wide range of softwares: IDA Pro, a popular AAA game, the Windows kernel, the Microsoft RDP client, NVIDIA GPU Display driver, etc.
Compiled binaries are available from either the CI artifacts or from the Releases section for both Windows & Linux.
If you would like to read more about its history or how to use it on a real target, I recommend to take a look at those posts to get started 🔥
- Building a new snapshot fuzzer & fuzzing IDA
- Fuzzing Modern UDP Game Protocols With Snapshot-based Fuzzers by Markus Gaasedelen
- Fuzzing RDPEGFX with "what the fuzz" by Colas Le Guernic, Jérémy Rubert, and Anonymous
- A Journey to Network Protocol Fuzzing – Dissecting Microsoft IMAP Client Protocol by Wayne Chin Yick Low
The best way to try the features out is to work with the fuzzer_hevd / fuzzer_tlv_server modules. You can grab the target-hevd.7z / target-tlv_server.7z archives and extract them into the targets/ directory. The archives contain the directory trees that are expected for every targets:
inputsis the folder where your input test-cases go into,outputsis the folder where the current minset files are saved into,coverageis the folder where the.covfiles are expected to be in,crashesis where the crashes gets saved in,stateis where the memory dump (mem.dmp) as well as the CPU state (regs.json) and the symbol store are stored in (symbol-store.json). The symbol store is a simple JSON file that is used on Linux systems to know where to put breakpoints as there is no support for symbols / dbgeng on those platforms. wtf generates this file at runtime everytime you run your target on Windows.
What follows assume that you downloaded the target-hevd.7z file attached to the latest release, and extracted it in the targets directory of your clone of wtf. You should have wtf/targets/hevd in which you find the inputs / outputs, etc. directories.
The server is basically the brain and keeps track of all the state: the aggregated code-coverage, the corpus, it generates and distributes the test-cases to client.
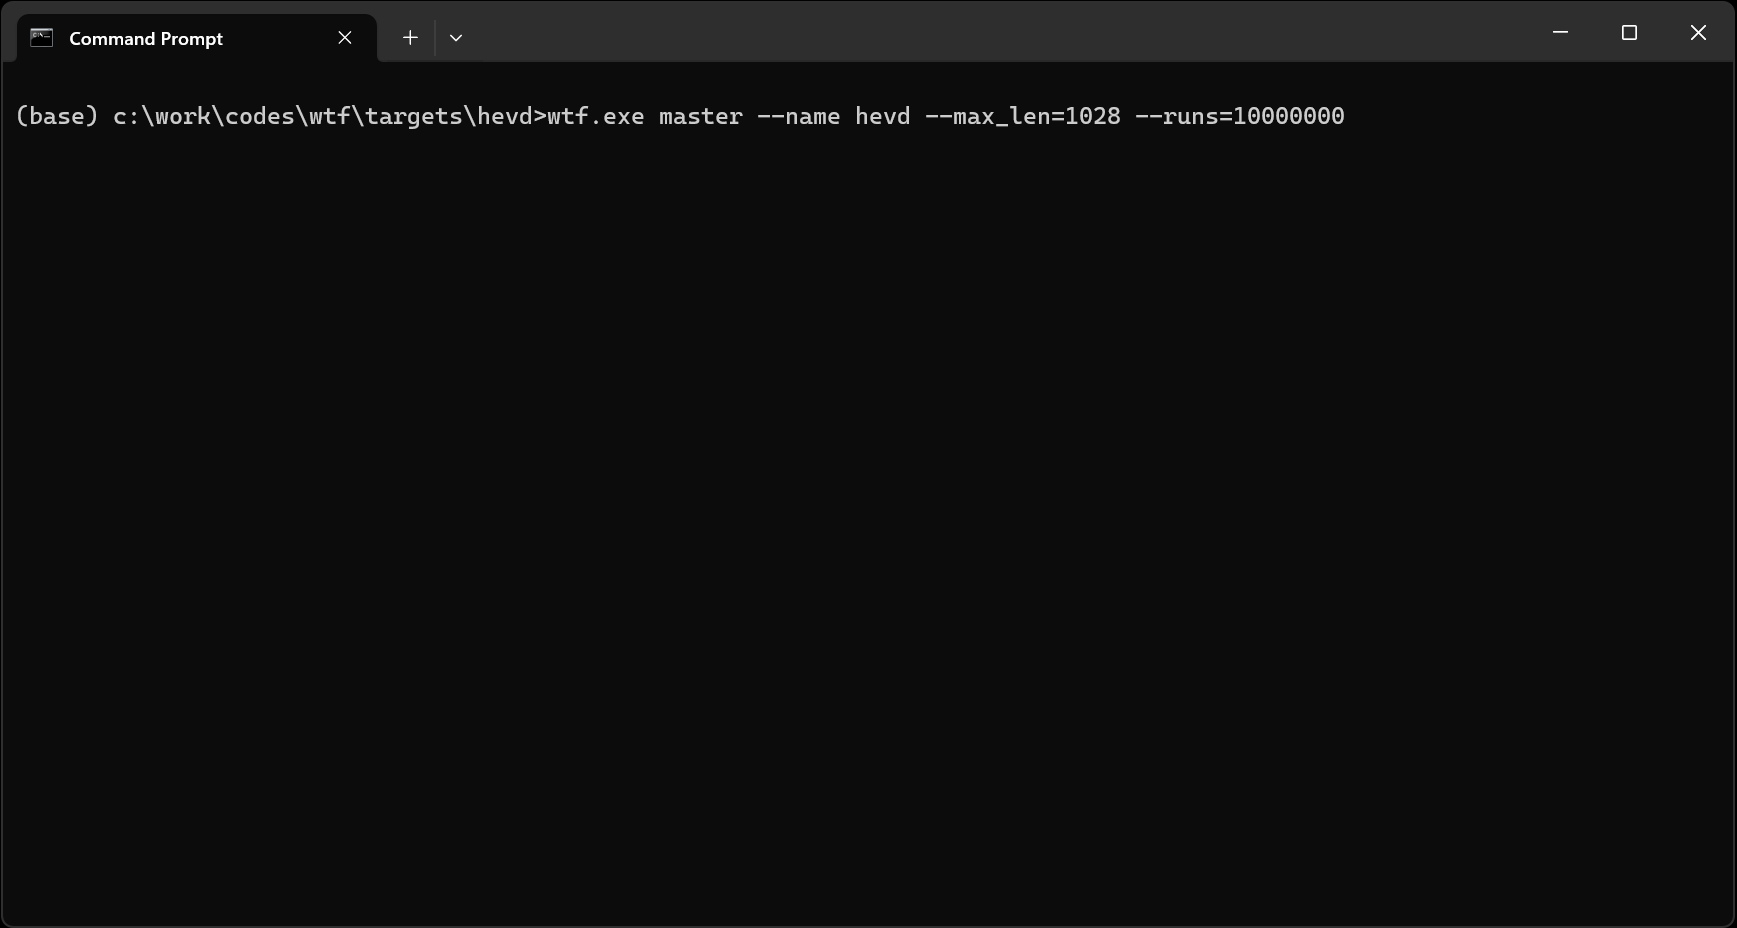
This is how you might choose to launch a local server node:
wtf.exe master --name hevd --max_len=1028 --runs=10000000
The max_len option is used to limit the size of the generated test-case, runs is the number of test-cases it will generate, address specify where wtf needs to be listening on, target is a directory with the directory tree we described above (the user can also choose to override those directories with --input / --output / --crashes) and name specifies your fuzzing module name so that the master can invoke your generator function if you have defined one.
The client nodes run a test-case that has been generated and distributed by the server and communicates the result back to the server (code-coverage, result, etc.).
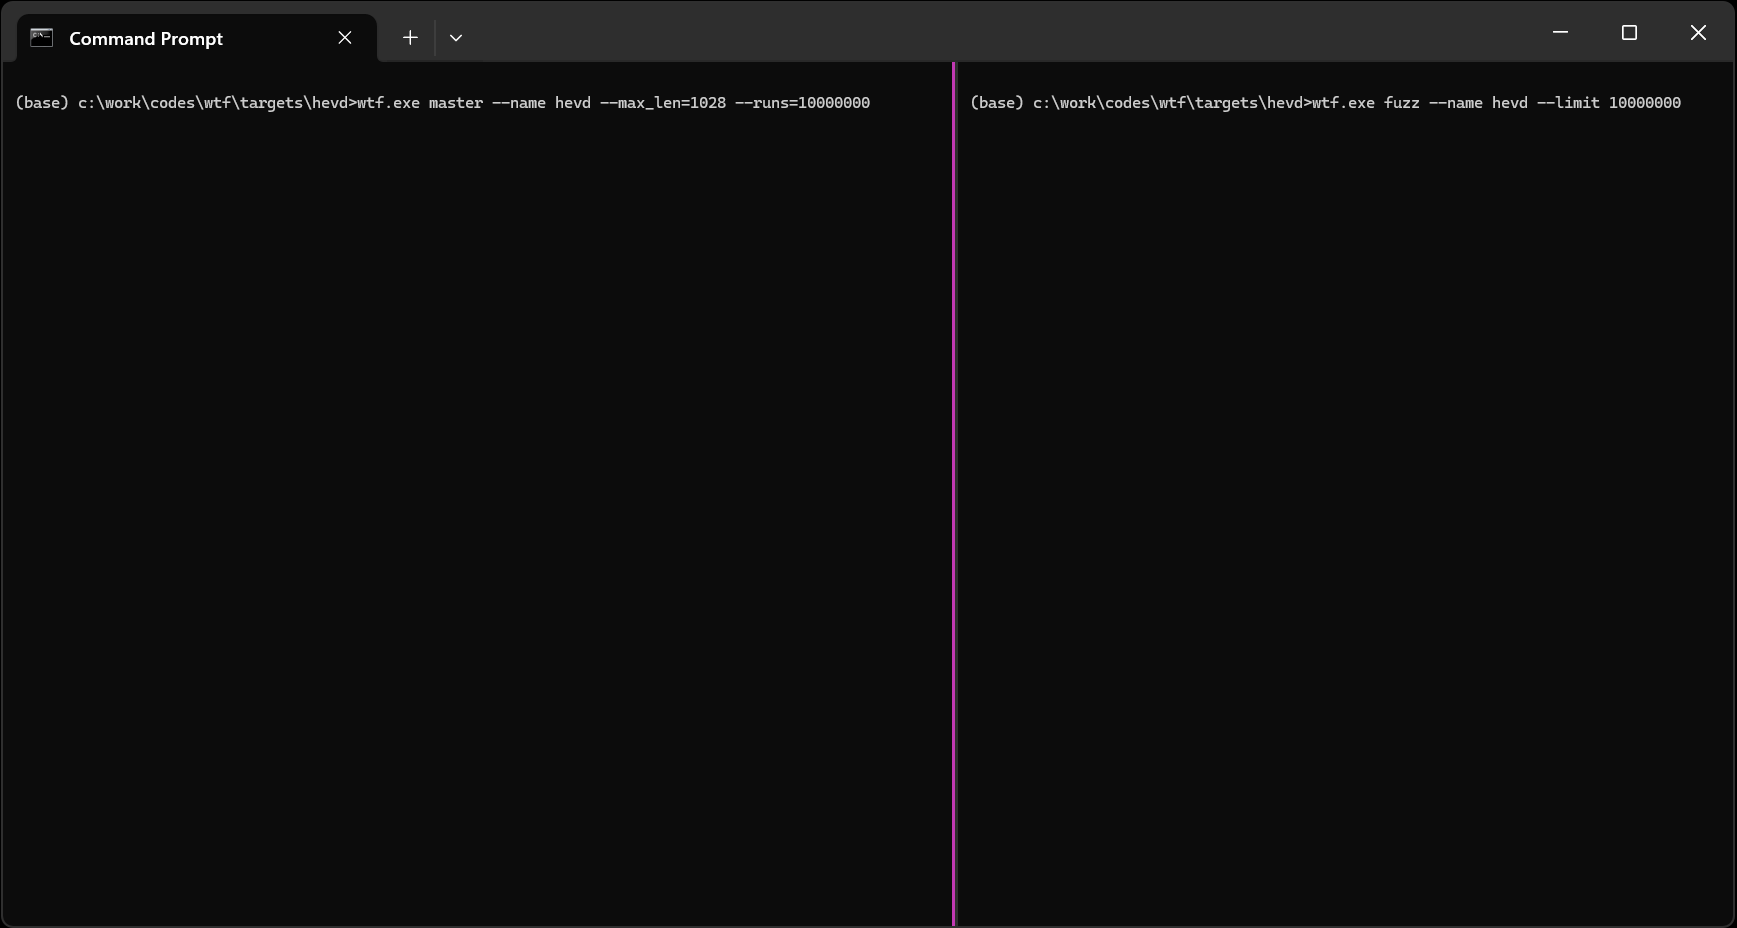
This is how you would start a client node that uses the bochscpu backend:
wtf.exe fuzz --name hevd --limit 10000000
The fuzz subcommand is used with the name option to specify which fuzzer module needs to be used, backend specifies the execution backend and limit the maximum number of instruction to execute per testcase (depending on the backend, this option has different meaning).
If you would like to run a test-case (or a folder filled with test-cases), you can use the run subcommand.
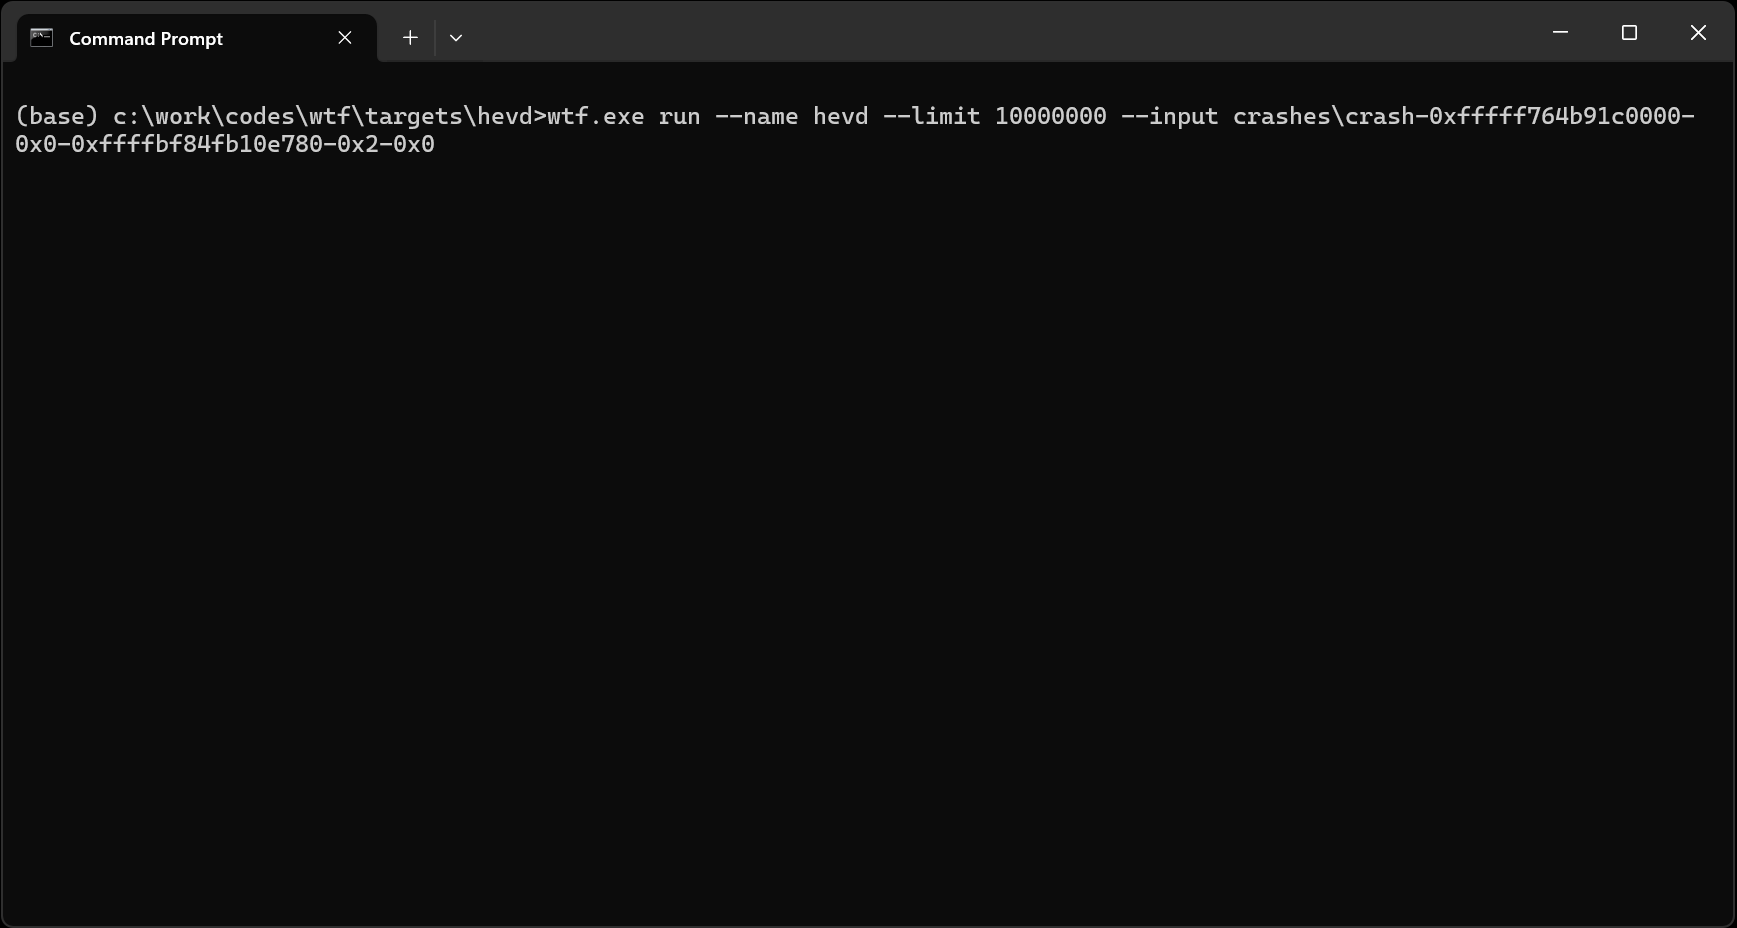
This is how you would would run the crash-0xfffff764b91c0000-0x0-0xffffbf84fb10e780-0x2-0x0 test-case:
wtf.exe run --name hevd --limit 10000000 --input crashes\crash-0xfffff764b91c0000-0x0-0xffffbf84fb10e780-0x2-0x0
To minset a corpus, you need to use a server node and as many client nodes as you need like you would for a fuzzing job. You can simply set the runs optins to 0.
This is how you would minset the corpus in outputs into the minset directory (also highlights how you can override the inputs and outputs directories):
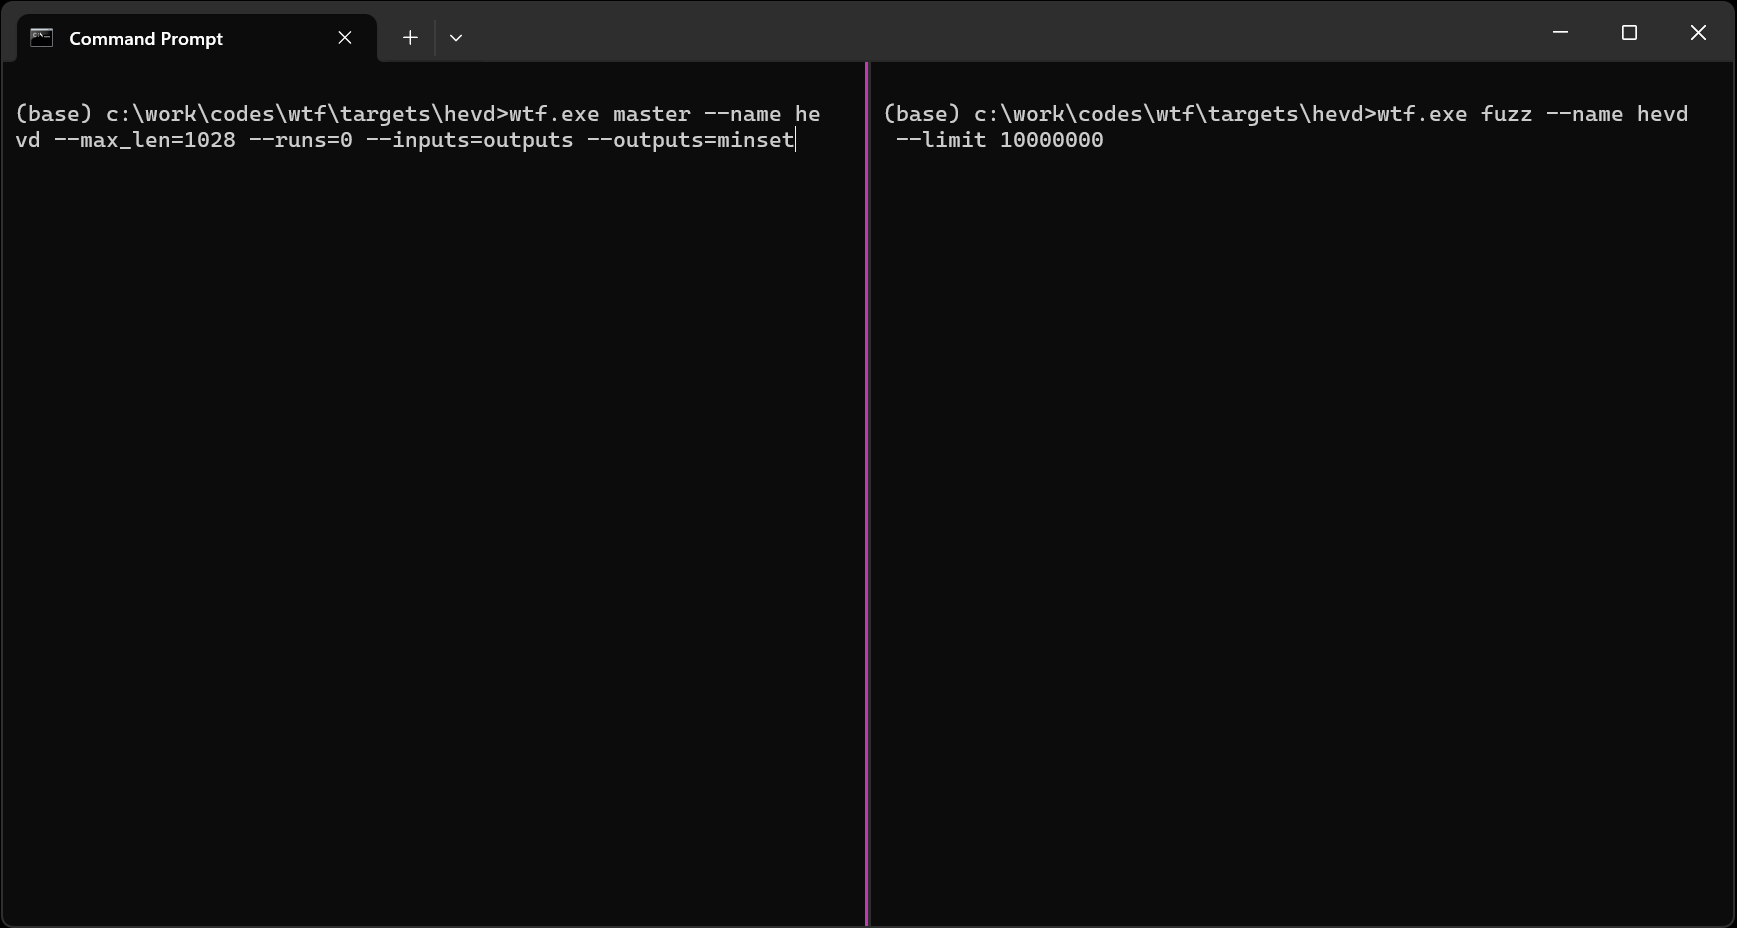
wtf.exe master --name hevd --max_len=1028 --runs=0 --inputs=outputs --outputs=minset
The main mechanism available to instrospect in an execution backend is to generate an execution trace. bochscpu is the fastest backend to do that, because exiting VMX mode is very expensive on the other backends.
This is how you would generate an execution trace for the crash-0xfffff764b91c0000-0x0-0xffffbf84fb10e780-0x2-0x0 test-case:
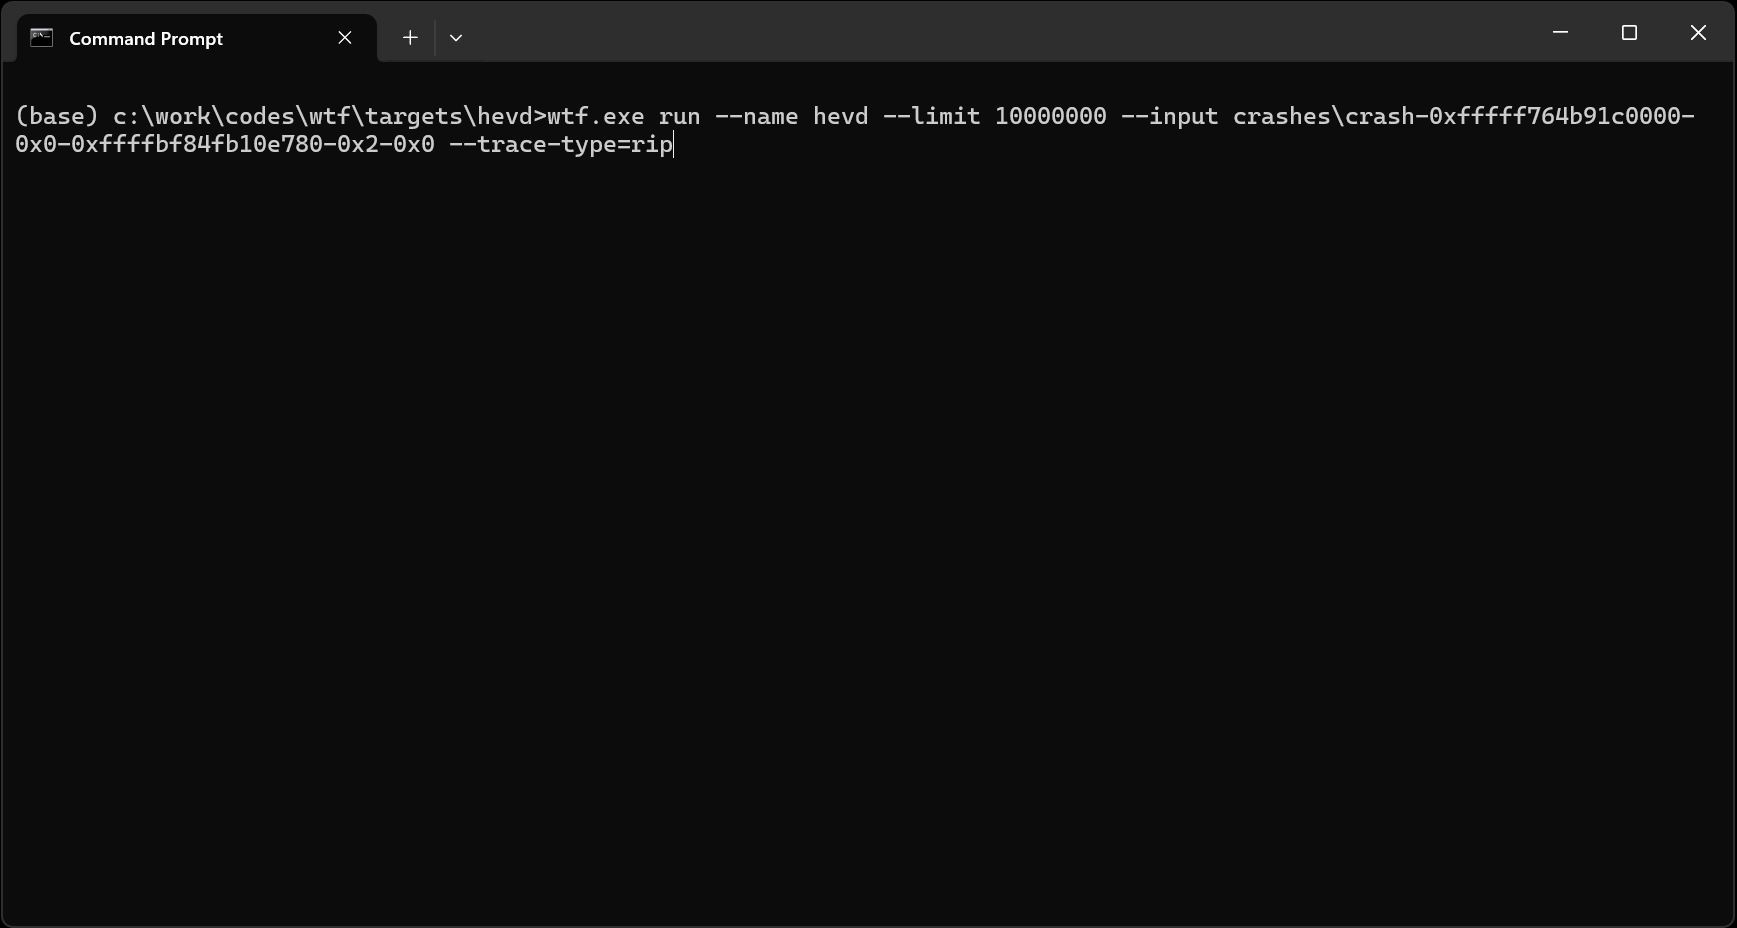
wtf.exe run --name hevd --limit 10000000 --input crashes\crash-0xfffff764b91c0000-0x0-0xffffbf84fb10e780-0x2-0x0 --trace-type=rip
To symbolize execution traces you should use symbolizer-rs. This is how you would symbolize the crash-0xfffff764b91c0000-0x0-0xffffbf84fb10e780-0x2-0x0.trace execution trace generated above:
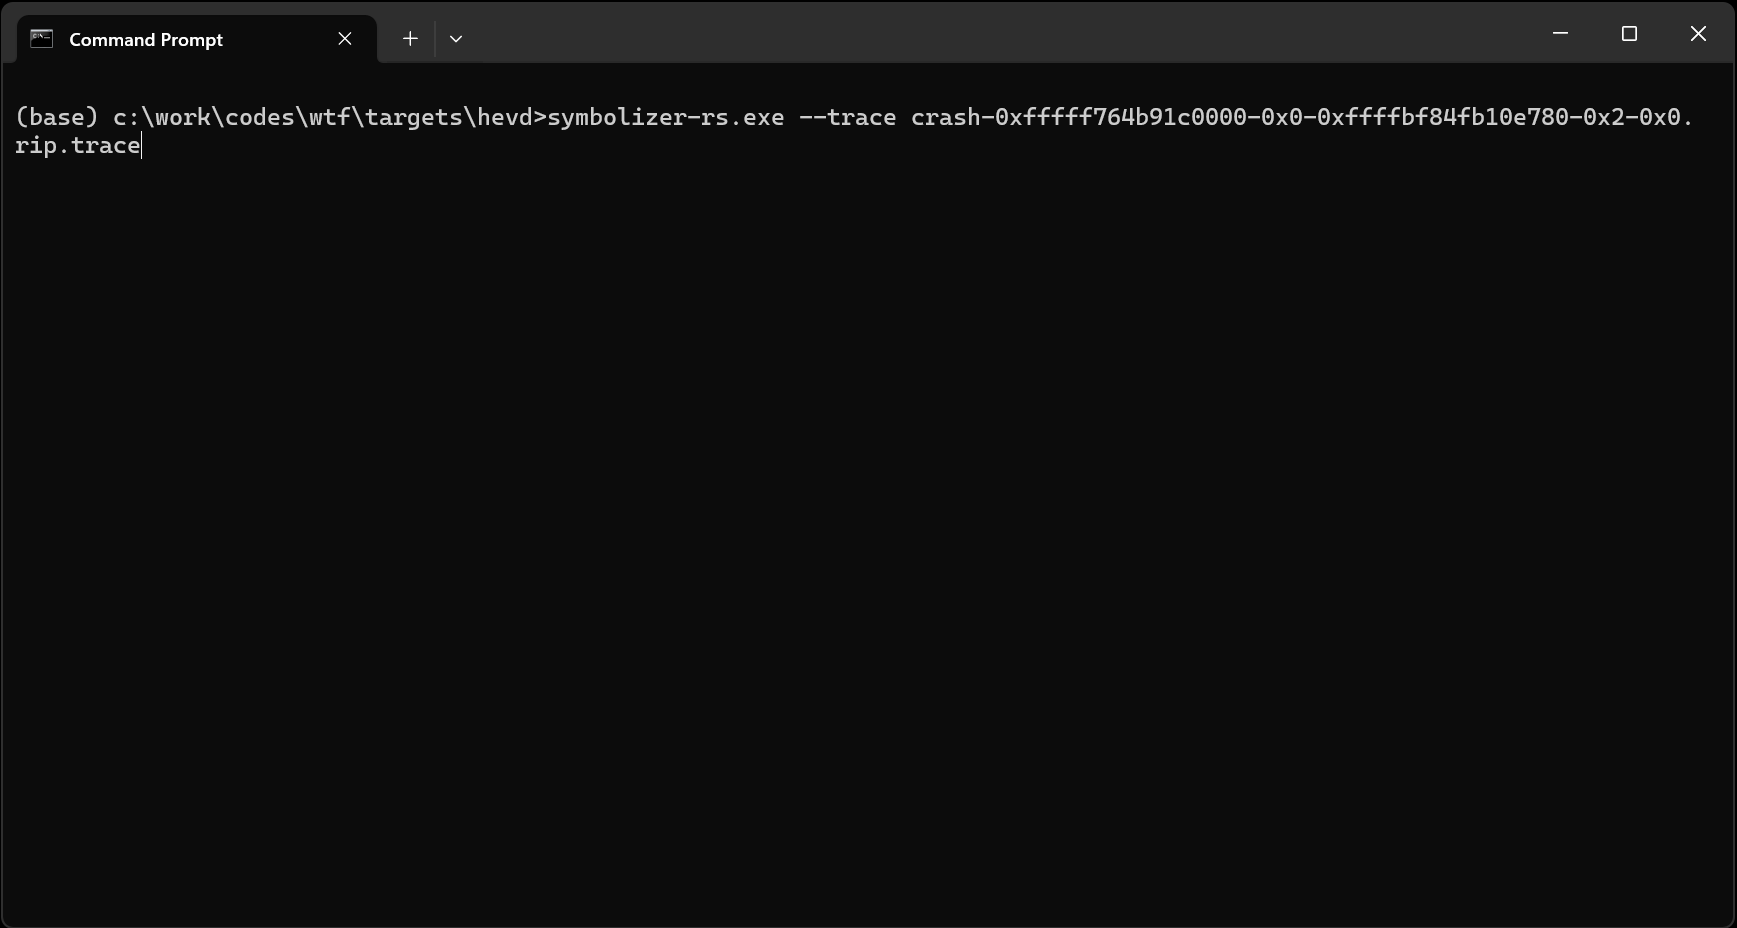
symbolizer-rs.exe --trace crash-0xfffff764b91c0000-0x0-0xffffbf84fb10e780-0x2-0x0.rip.trace
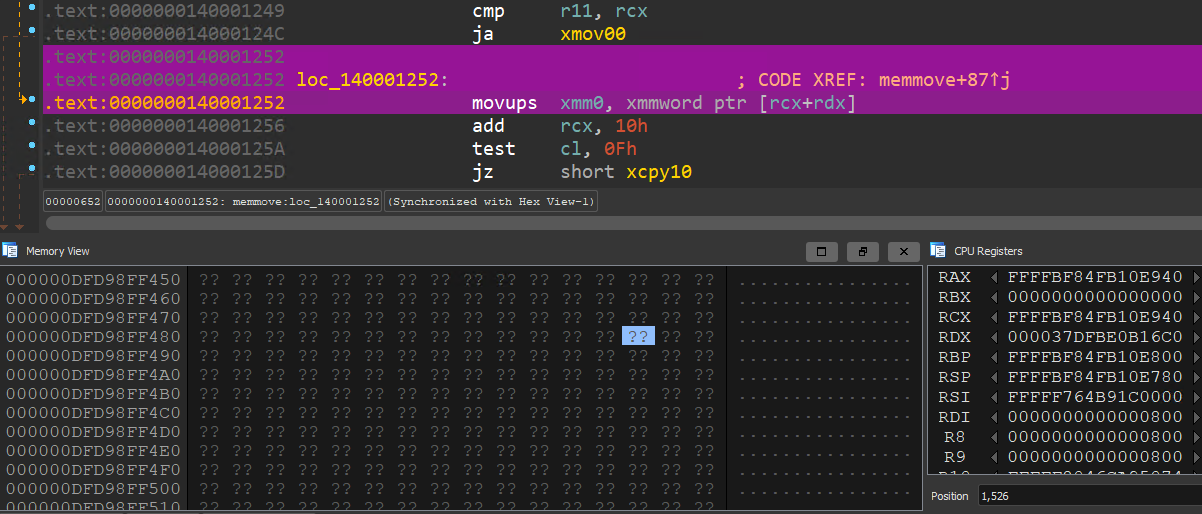
If you see yourself needing more contextual awareness, the bochscpu backend allows you to generate execution traces that can be loaded in the Tenet trace explorer. In the below, I start from a crash in memmove and walk back to find out where the source pointer is coming from (user-mode!):
wtf.exe run --name hevd --limit 10000000 --input crashes\crash-0xfffff764b91c0000-0x0-0xffffbf84fb10e780-0x2-0x0 --trace-type=tenet
To generate code-coverage traces you can simply use the run subcommand with the --trace-type=cov option.
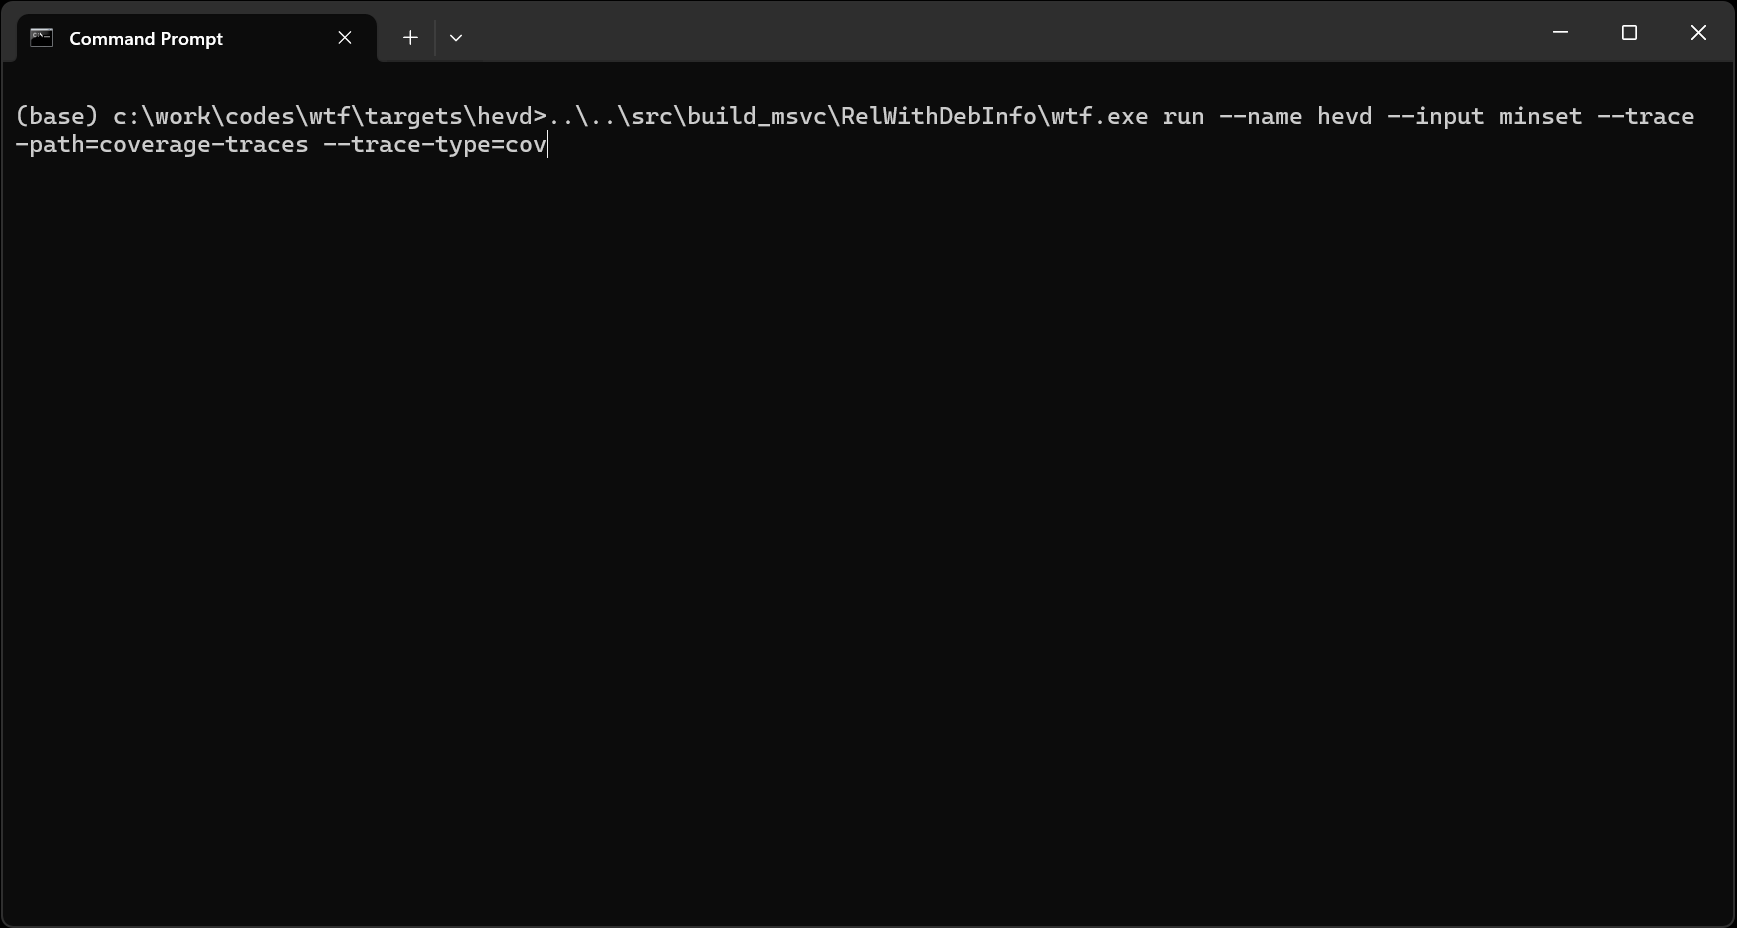
This is how you would generate code-coverage traces for all the files inside the minset folder and store them in the coverage-traces folder:
wtf.exe run --name hevd --input minset --trace-path=coverage-traces --trace-type=cov
Those traces aren't directly loadable into lighthouse because they aren't symbolized.
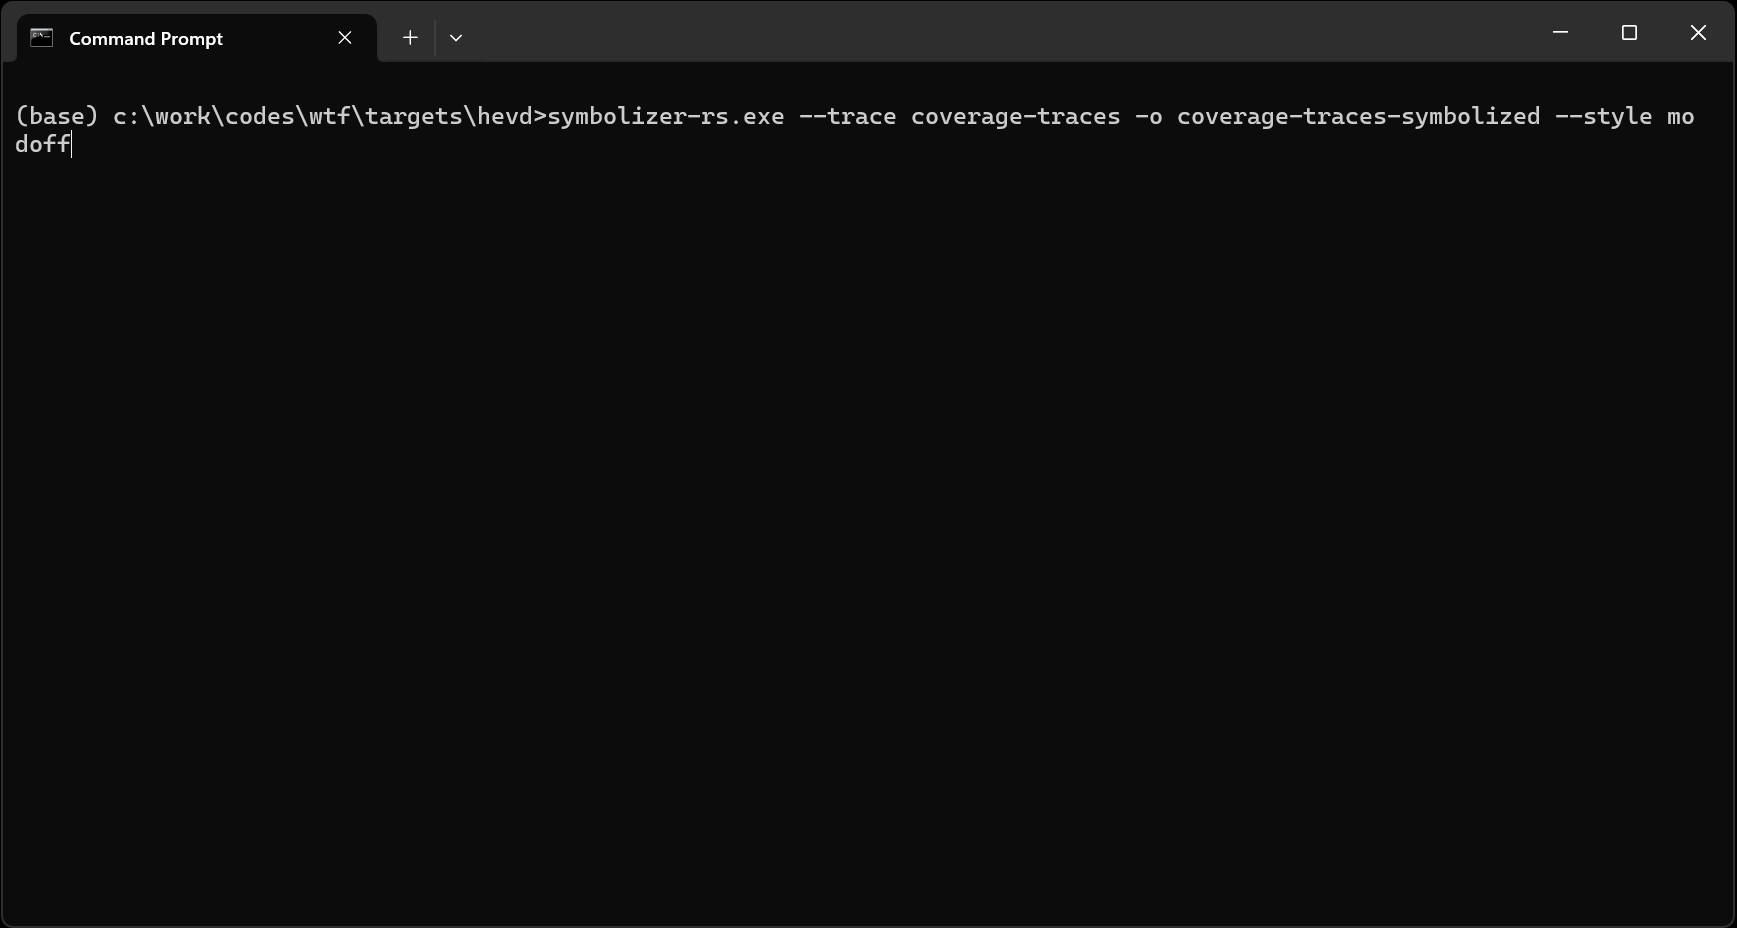
This is how you would symbolize all the files inside the coverage-traces folder and write the results into coverage-traces-symbolized:
symbolizer-rs.exe --trace coverage-traces -o coverage-traces-symbolized --style modoff
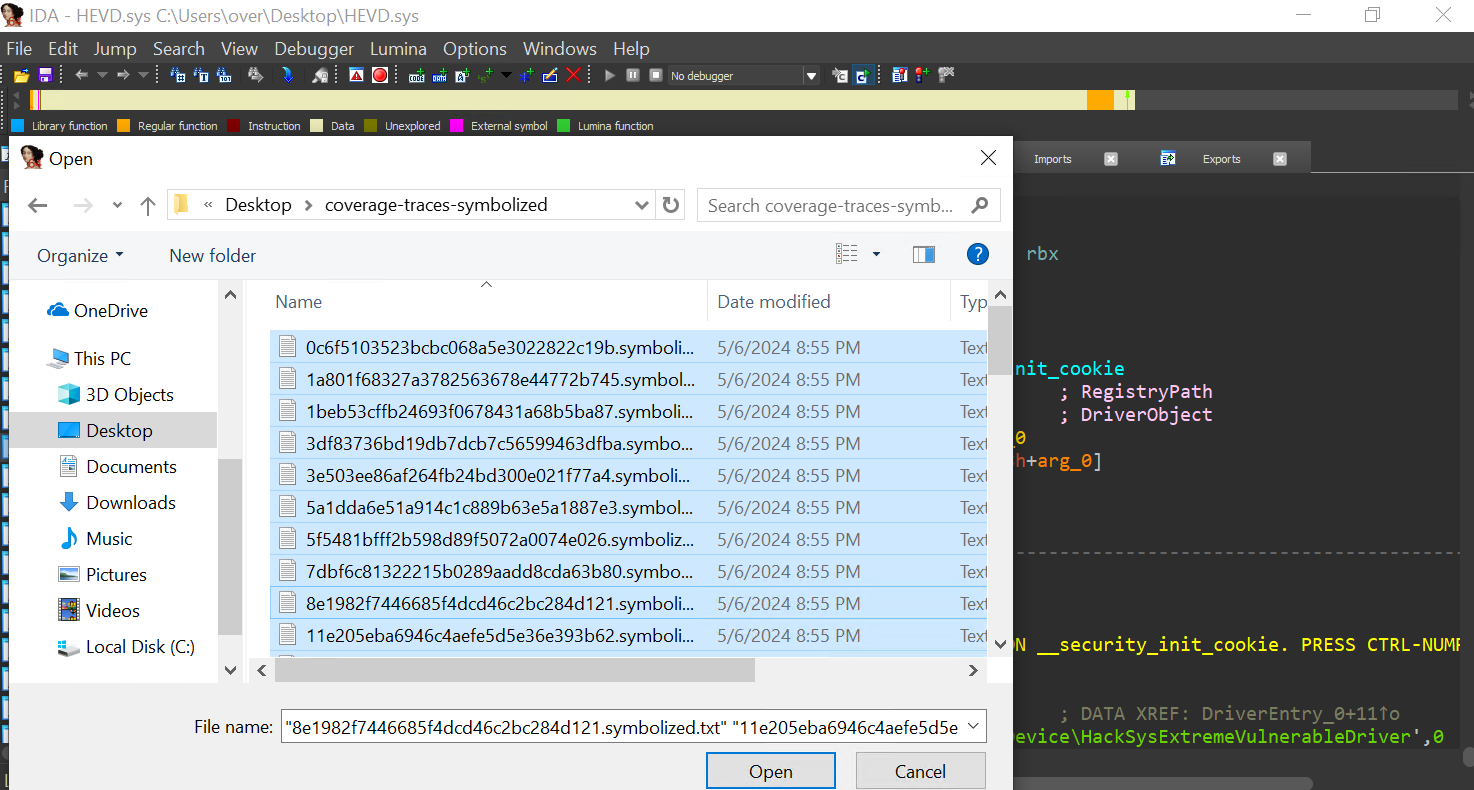
And finally, you can load those up in lighthouse:
Also if you don't care about individual code-coverage, the master maintains a coverage.cov file contains the unique aggregated code-coverage that has been exercised. It makes it easy to check on the global code-coverage really quick during a fuzzing job.
wtf runs user & kernel mode through an execution backend and relies on the user to insert test-cases in the target. Unlike other classical fuzzer tools, wtf doesn't do much of the heavy lifting; the user does. The user needs to know the harnessed target very well and onboarding a target is an iterative process that will take time. It has a lot of flexibility to offer if you are ready to get hacking though :)
The usual workflow to harness a target is as follows:
-
Get your target running into a Hyper-V VM running Windows with one virtual CPU and 4GB of RAM.
-
Put your target into the desired state using KD. For example, to target HEVD's IOCTL handler, I chose to stop the target in user-mode right before the client invokes DeviceIoControl. This will vary depending on your targets but you probably want it to be close to the code you want to fuzz.
kd> r rax=000000dfd98ff3d0 rbx=0000000000000088 rcx=0000000000000088 rdx=00000000deadbeef rsi=0000000000000000 rdi=0000000000000000 rip=00007ff6f5bb111e rsp=000000dfd98ff380 rbp=0000000000000000 r8=000000dfd98ff3d0 r9=0000000000000400 r10=000002263e823055 r11=00007ff6f5bcb54d r12=0000000000000000 r13=0000000000000000 r14=0000000000000000 r15=0000000000000000 iopl=0 nv up ei pl nz na po nc cs=0033 ss=002b ds=002b es=002b fs=0053 gs=002b efl=00000206 hevd_client!main+0xae: 00007ff6`f5bb111e ff15dc1e0100 call qword ptr [hevd_client!_imp_DeviceIoControl (00007ff6`f5bc3000)] ds:002b:00007ff6`f5bc3000={KERNEL32!DeviceIoControlImplementation (00007ff8`3e2e6360)} -
Use snapshot to generate the kernel crash-dump as well as the
regs.jsonfile that contains the CPU state. I recommend to dump those file in astatedirectory under yourtargetdirectory (targets/hevd/statefor example):kd> .load c:\work\codes\snapshot\target\release\snapshot.dll kd> !snapshot -h [snapshot] Usage: snapshot [OPTIONS] [STATE_PATH] Arguments: [STATE_PATH] The path to save the snapshot to Options: -k, --kind <KIND> The kind of snapshot to take [default: full] [possible values: active-kernel, full] -h, --help Print help kd> !snapshot c:\work\codes\wtf\targets\hevd\state [snapshot] Dumping the CPU state into c:\work\codes\wtf\targets\hevd\state\regs.json.. [snapshot] Dumping the memory state into c:\work\codes\wtf\targets\hevd\state\mem.dmp.. Creating c:\\work\\codes\\wtf\\targets\\hevd\\state\\mem.dmp - Full memory range dump 0% written. 5% written. 1 min 50 sec remaining. 10% written. 1 min 17 sec remaining. 15% written. 1 min 30 sec remaining. [...] Wrote 4.0 GB in 1 min 32 sec. The average transfer rate was 44.5 MB/s. Dump successfully written [snapshot] Done! -
Create a fuzzer module, write the code that inserts a test-case into your target and define the various conditions to detect crashes or the end of a test-case.
-
You can also create your own mutator / generator by subclassing the Mutator_t interface. The fuzzer_tlv_server.cc is a good example to understand how you would go about implementing your own.
At this point you should start to iterate and verify that the fuzzer module works as expected. The execution backends are a blackbox so you should generate execution traces to make sure it goes through the right paths, does the right things. During this phase I mainly use the bochscpu backend as it is fully deterministic, starts fast, generating execution traces is possible, code-coverage comes for free, etc. Overall, it's a nicer environment to develop and prototype in.
Once you are satisfied with the module, you can start to look at making it work with the winhv / kvm backends if you need it to run under those. One major difference between the bochscpu backend & the others, is that the others use software breakpoints to provide code-coverage information. As a result, you'll need to load the modules you want coverage for under IDA and use the gen_coveragefile_ida.py script to generate a simple JSON file that gets loaded by wtf. You are free to generate this JSON file yourself using whatever tool you would like: it basically is a list of basic-blocks virtual addresses.
You can also target WoW64 applications by using the !wow64exts.sw Windbg command to switch to the 64-bit context right before creating the snapshot (thanks @cube0x8 for sharing this trick!):
32.kd:x86> !wow64exts.sw
The context is partially valid. Only x86 user-mode context is available.
Switched to Host mode

32.kd> !snapshot
Complex targets usually carry complex states as well and chances are that you might need to deliver more than one testcase in a session to trigger complex issues. tlv_server.cc is an example of such a server where exercising the parsing function with only one testcase won't be enough to uncover the bugs.
To handle this case, check out fuzzer_tlv_server.cc that shows an example of how to solve this problem.
wtf comes with two popular generic mutators: libfuzzer & honggfuzz. You might want to provide your own or to generate testcases on your own as well.
To do that, you can subclass the Mutator_t interface, and register the function that instantiate your mutator when you define your fuzzing module:
class CustomMutator_t : public Mutator_t {
public:
  static std::unique_ptr<Mutator_t> Create(std::mt19937_64 &Rng,
                                           const size_t TestcaseMaxSize) {
    return std::make_unique<CustomMutator_t>(Rng, TestcaseMaxSize);
  }
  // ...
};

Target_t target("target", Init, InsertTestcase, Restore, CustomMutator_t::Create);
Check out the CustomMutator_t class in the fuzzer_tlv_server.cc module for a complete example.
In this section I briefly mention various differences between the execution backends.
- ✅ Full system code-coverage (edge coverage available via
--edges), - ✅ Demand-paging,
- ✅ Timeout is the number of instructions which is very precise,
- ✅ Full execution traces are supported,
- ✅ Fully deterministic,
- ❌Speed seems to be good for short executions but not for long executions (~100x slower than KVM when I was fuzzing IDA).
- ✔ Code-coverage via software breakpoints,
- ❌ Demand-paging so start-up is slow (as it needs to load the full crash-dump in memory),
- ✔ Timeout is implemented with a timer,
- ✅ Full execution traces are supported but are slow (exiting VMX is costly),
- ✔ Deterministic if handling source of non determinism manually (for example, patching
nt!ExGenRamdomthat usesrdrand), - ✔ Speed seems to be ok for long executions (lots of bottleneck in whv though; ~10x slower than kvm when I was fuzzing IDA).
- ✔ Code-coverage via software breakpoints,
- ✅ Demand-paging is supported via UFDD,
- ✔ Timeout is implemented with a timer. ✅ If the hardware supports PMU virtualization, it is used to generate a PMI after X retired instructions (
MSR_IA32_FIXED_CTR0), - ✅ Full execution traces are supported but are slow (exiting VMX is costly),
- ✔ Deterministic if handling source of non determinism manually (for example, patching
nt!ExGenRamdomthat usesrdrand), - ✅ Fastest for long executions (~500m - 1.5 billion instructions; ~100x faster than bochscpu, ~10x faster than whv when I was fuzzing IDA).
The CI builds wtf on Ubuntu using both clang++ / g++, on Windows using Microsoft's Visual Studio and on OSX using clang++.
To build it yourself you need to start a Visual Studio Developper Command Prompt and either run build-release.bat which uses the Ninja generator or build-release-msvc.bat to generate a Visual Studio solution file:
(base) wtf\src\build>build-release.bat
[...]
[2/2] Linking CXX executable wtf.exe

(base) wtf\src\build_msvc>..\build\build-release-msvc.bat
[...]
  Finished generating code
  wtf.vcxproj -> wtf\src\build_msvc\RelWithDebInfo\wtf.exe
  Building Custom Rule wtf/src/CMakeLists.txt
- Axel '0vercl0k' Souchet
Special thanks to:
- @yrp604 for providing valuable inputs throughout the project,
- @masthoon for suggesting to write a demo targeting HEVD secure mode,
- Markus Gaasedelen for adding Tenet support,
- @y0ny0ns0n for contributing the multi-input fuzzing example,
- Colas Le Guernic / Jérémy Rubert / Anonymous for implementing edge coverage for bochscpu,
- @1ndahous3 for contributing the generic ioctl fuzzer module,
- Jason Crowder / Kyle Ossinger from Cisco ASIG for the Linux mode,
- and all the other contributors 🙏
