MAPLE is a Pin-based profiler to provide dumping memory access traces of applications at page-level. Currently, it records the accessed virtual page number, timestamp and r/w.
The supported output format is only csv at the moment; binary and vscsi will be added soon.
MAPLE has a built-in LRU cache helping to eliminate redundant items which may get answered by front layer caches.
[1] Install the Pin tool on your Linux machine. Download, unpack a kit and cd to the directory.
$ tar zxf pin-[version].tar.gz
$ cd pin-[version]/source/tools
[2] Clone the MAPLE! 🍁
$ git clone https://github.com/0xreza/maple-profiler.git
[3] Make the module (for your target architecture):
$ cd maple-profiler
$ mkdir obj-intel64
$ make obj-intel64/maple.so TARGET=intel64
[4] Run the experiment:
$ ../../../pin -t obj-intel64/maple.so -- [target_program]
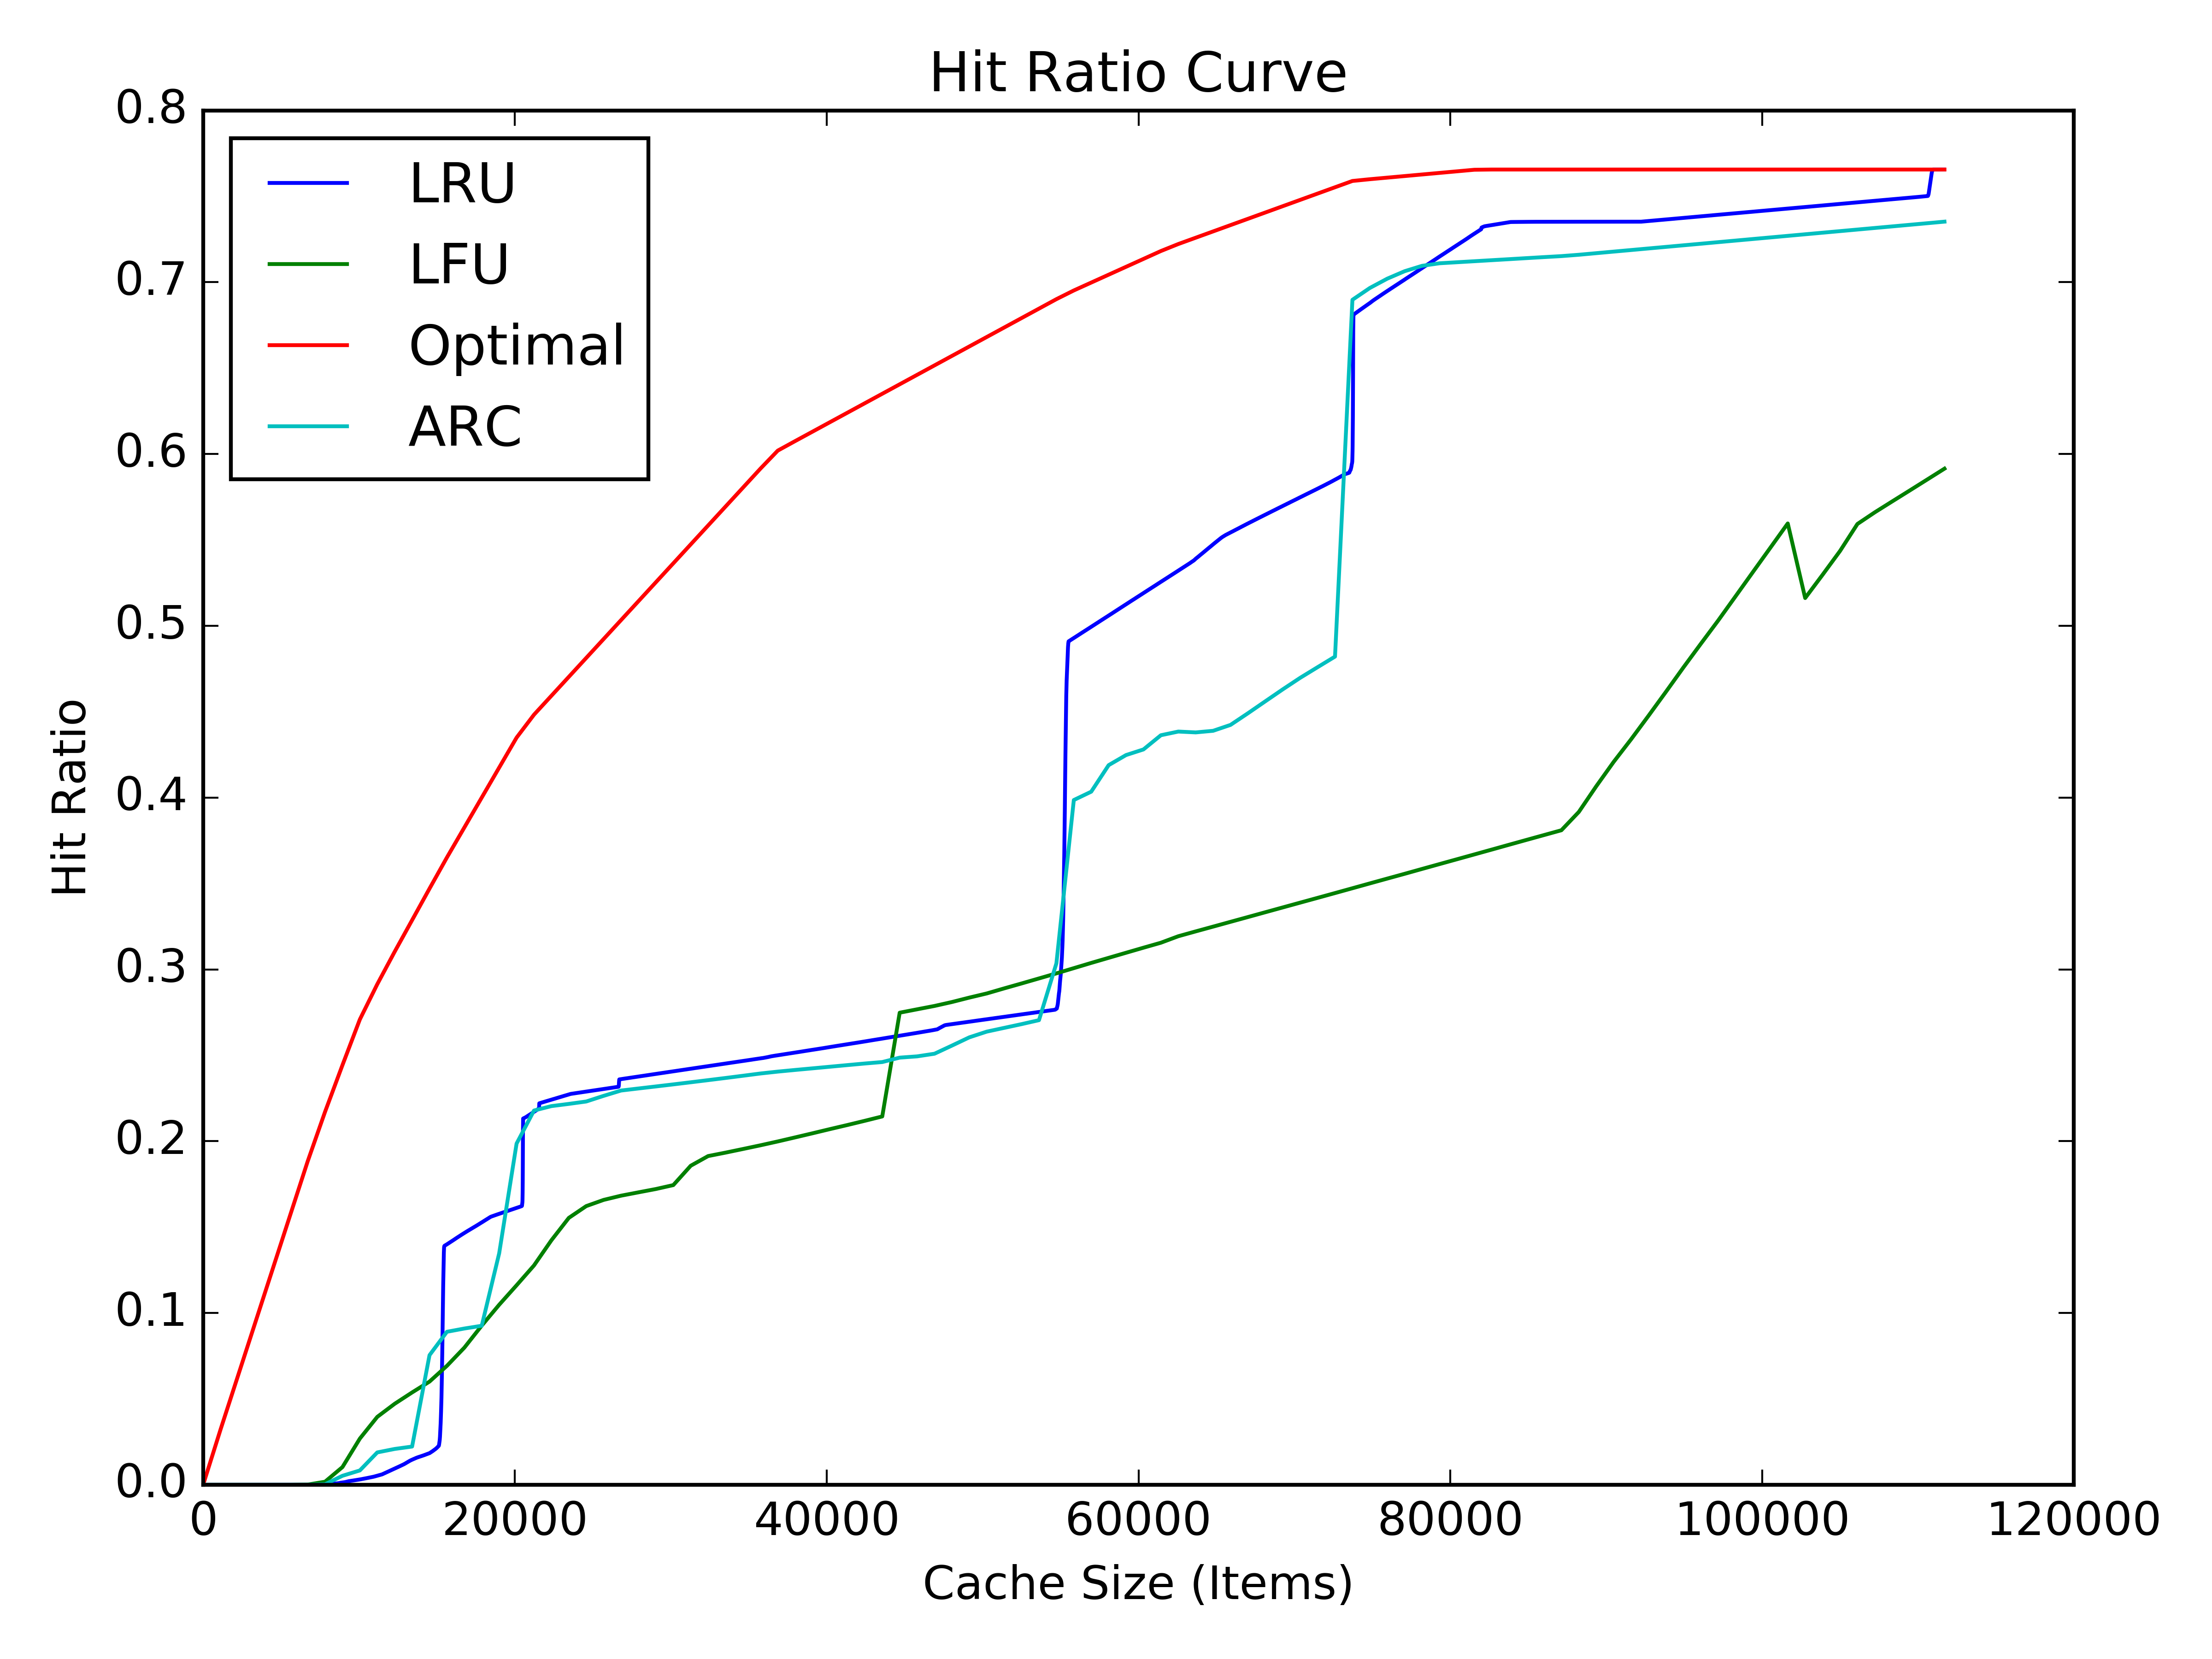
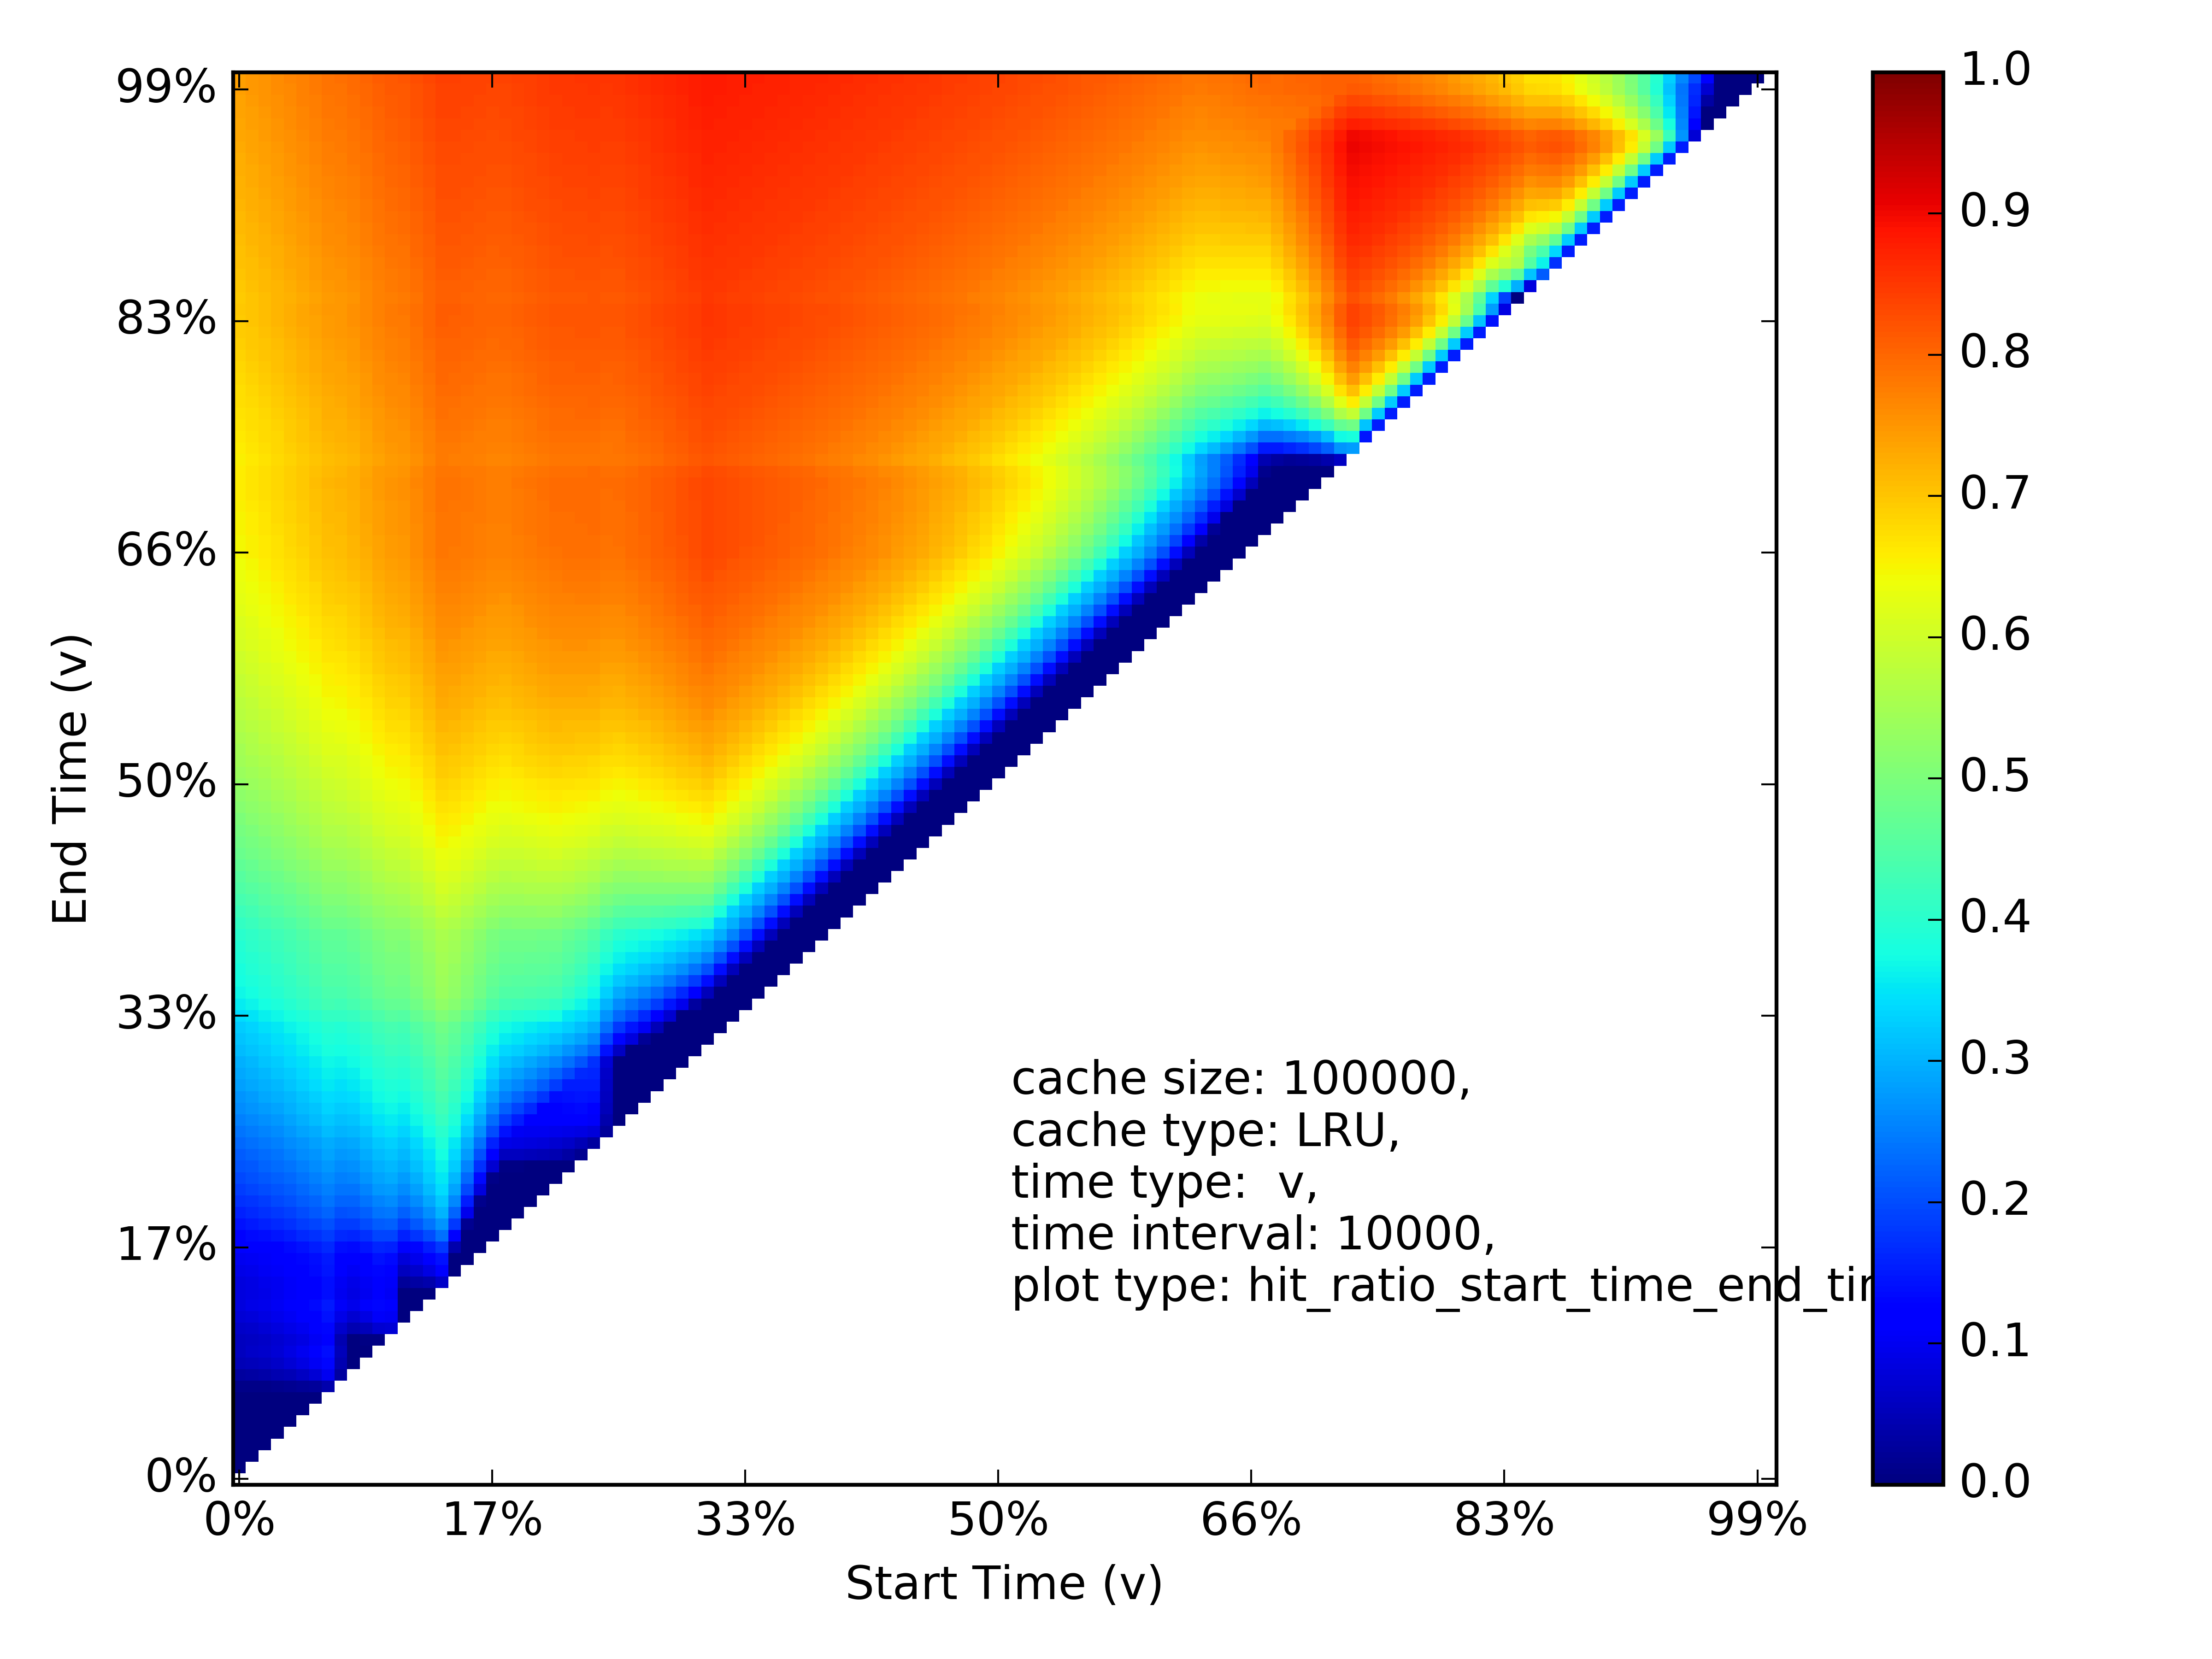
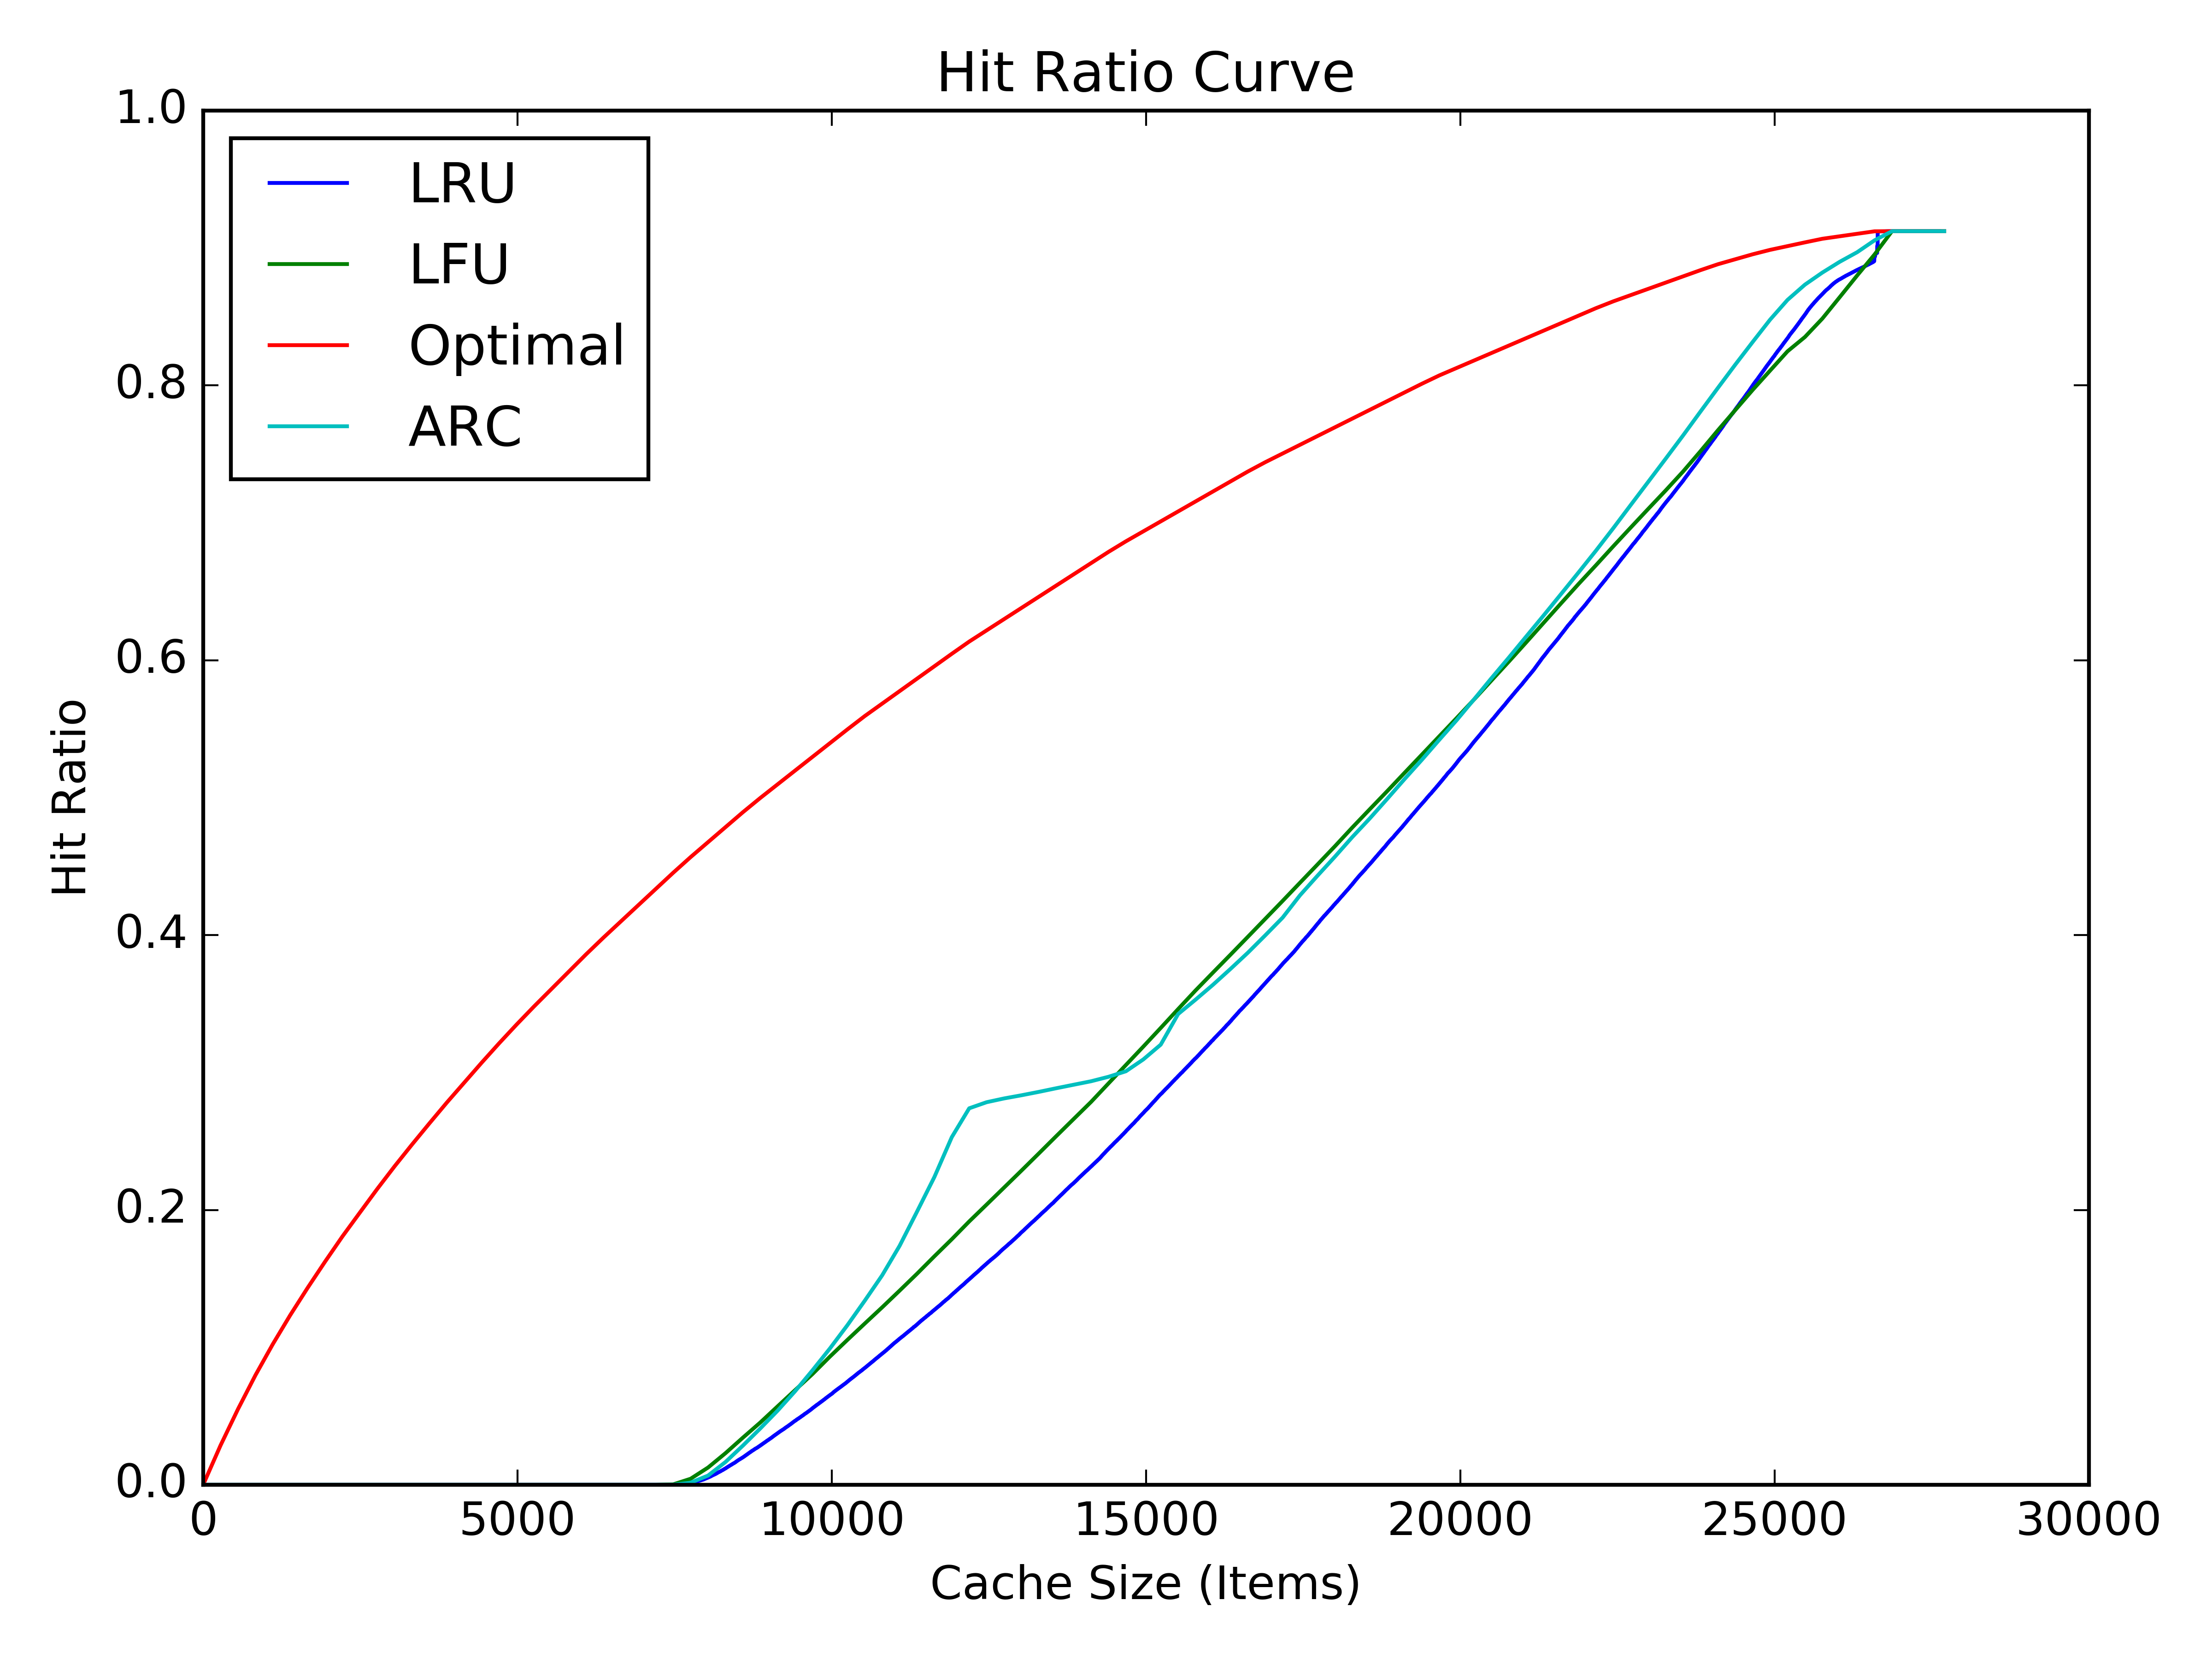
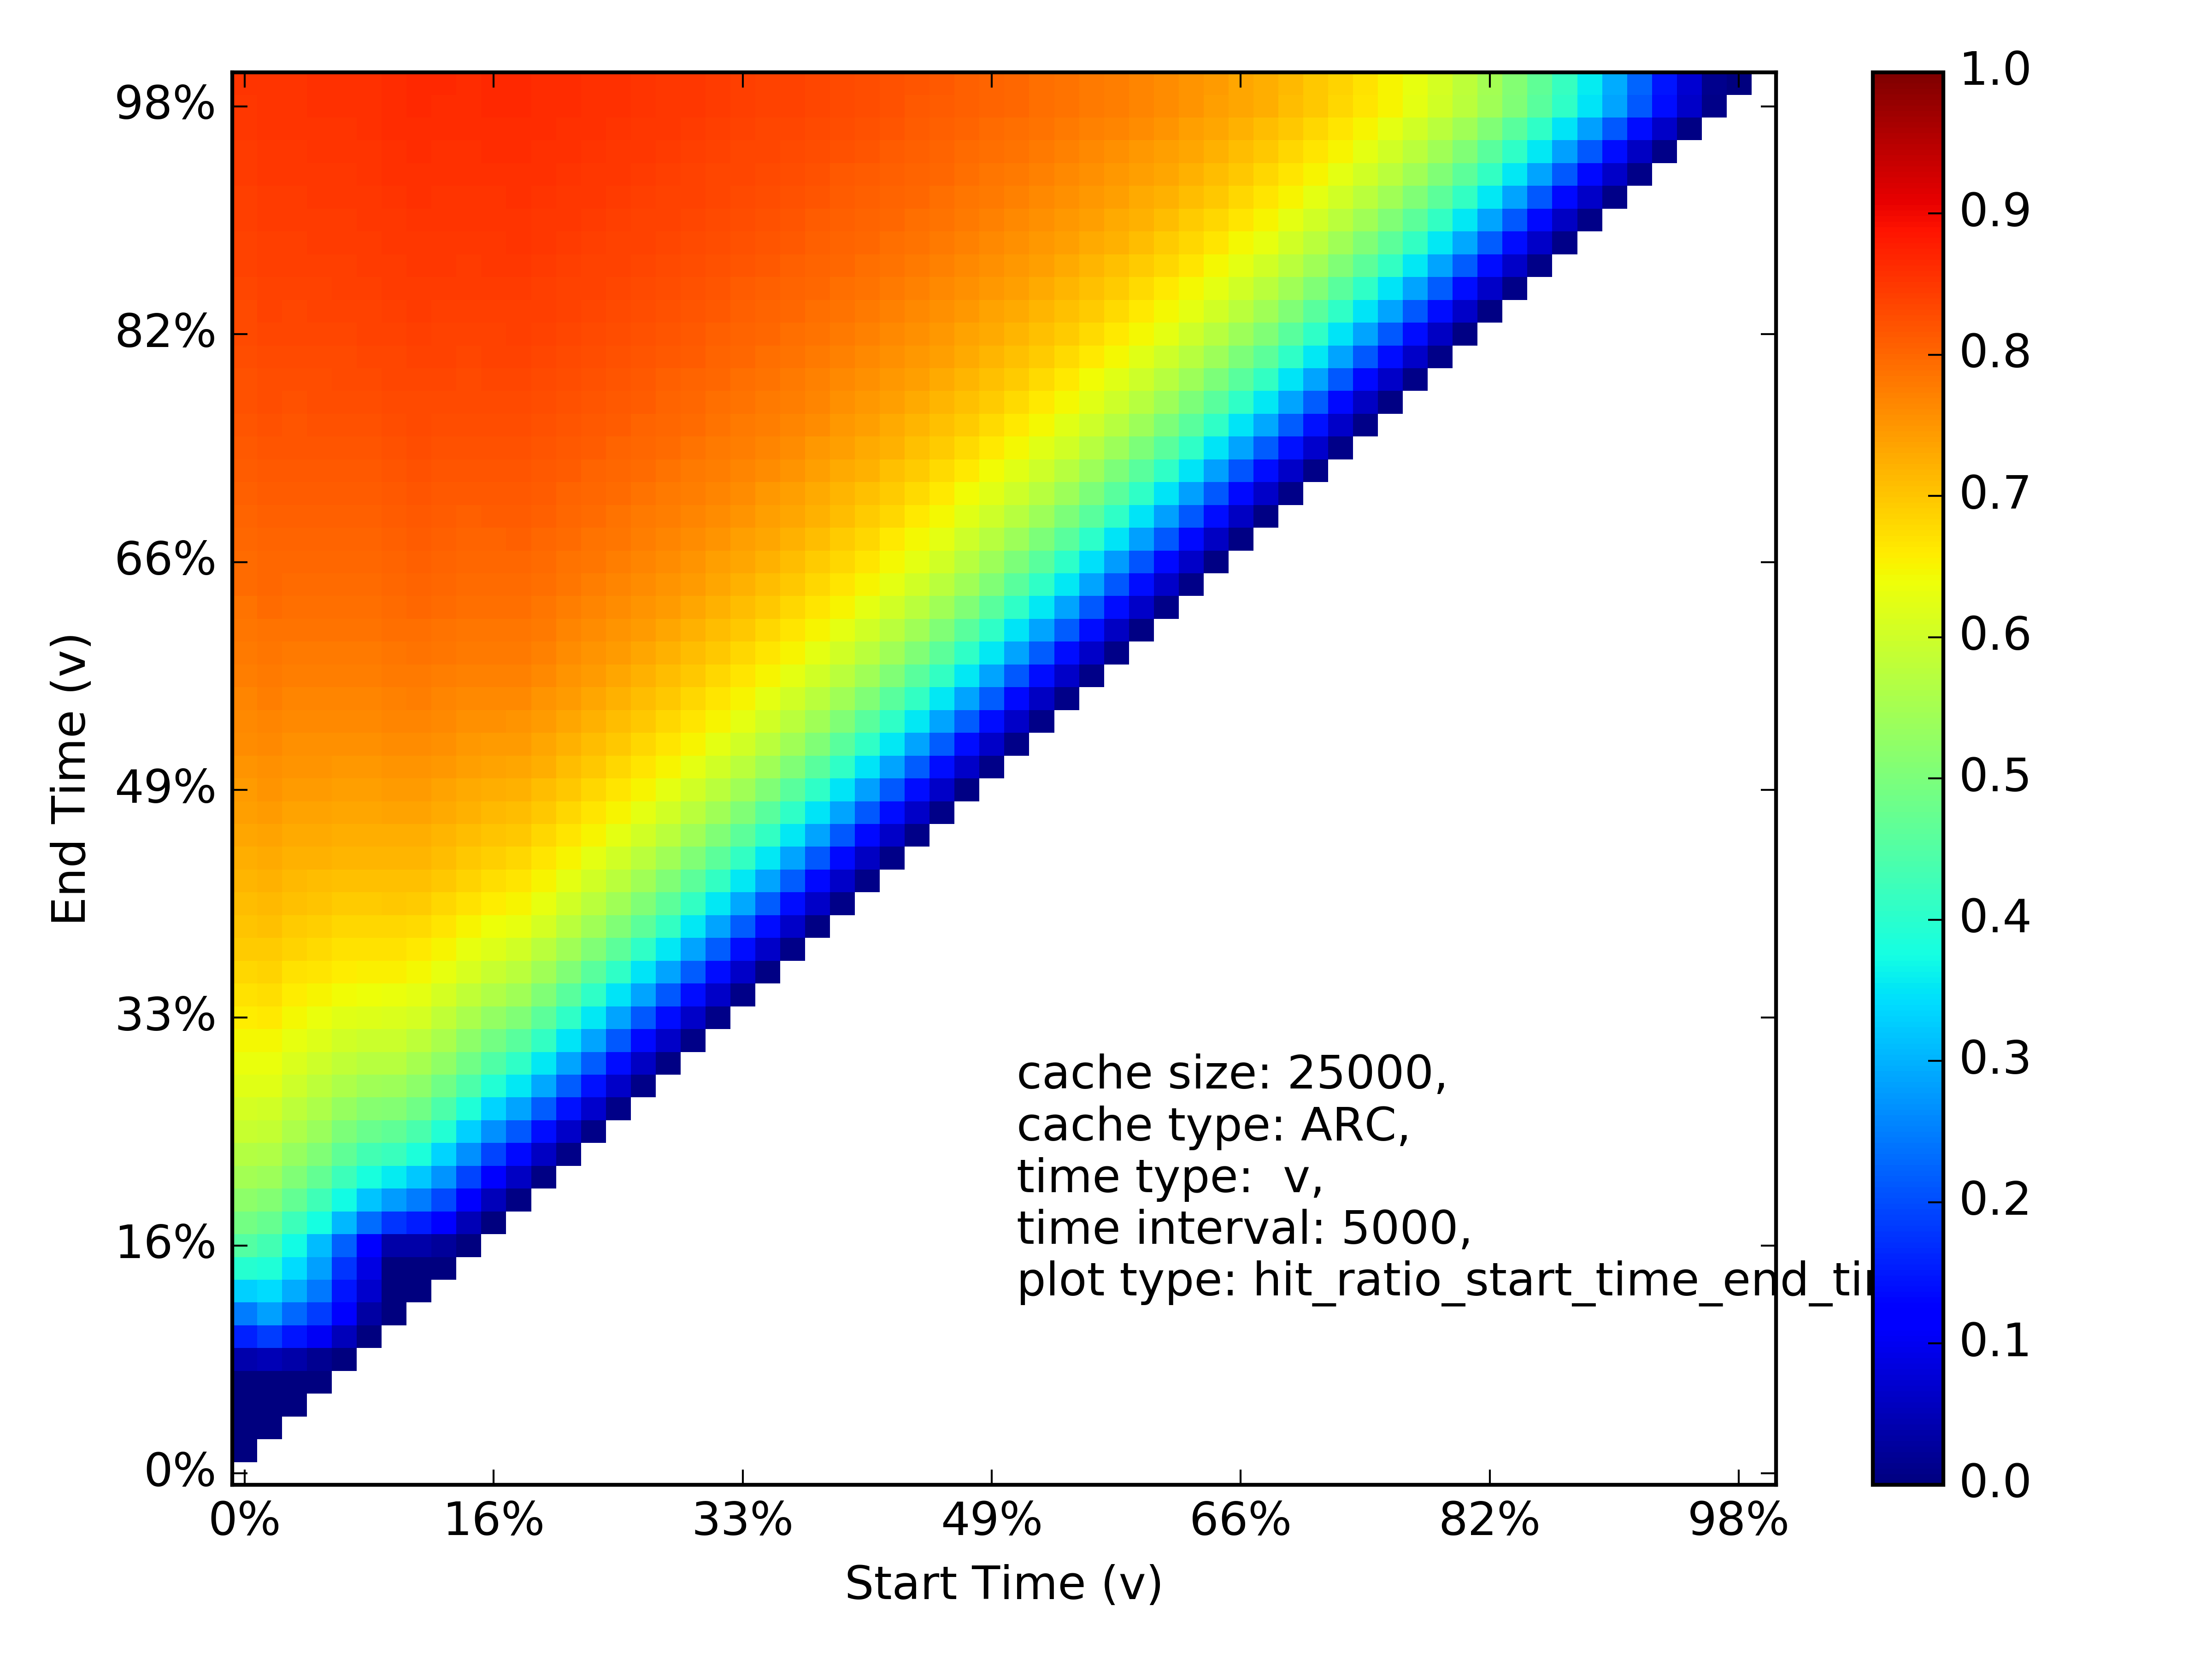
[5] You can feed your trace into Mimircache! to get insightful heat-maps and hit-ratio curves!
plotted using traces gathered from PARSEC, ocean_ncp benchmark.
plotted using traces gathered from PARSEC, streamcluster benchmark.
- Supporting compact output formats
- Supporting spatio/temporal sampling
Maple is released on public domain under GPLv3, created by Reza Karimi, PhD candidate at SimBioSysLab, Emory University, while interning at INESC-ID, Lisbon (Summer 2018) with invaluable help of (and base code from) David Gureya (PhD student at Instituto Superior Técnico); and coaching by Joao Barreto, my internship mentor.
Contributions and suggestions are welcome!


