``
Please see test.py
The simple 3D plot:
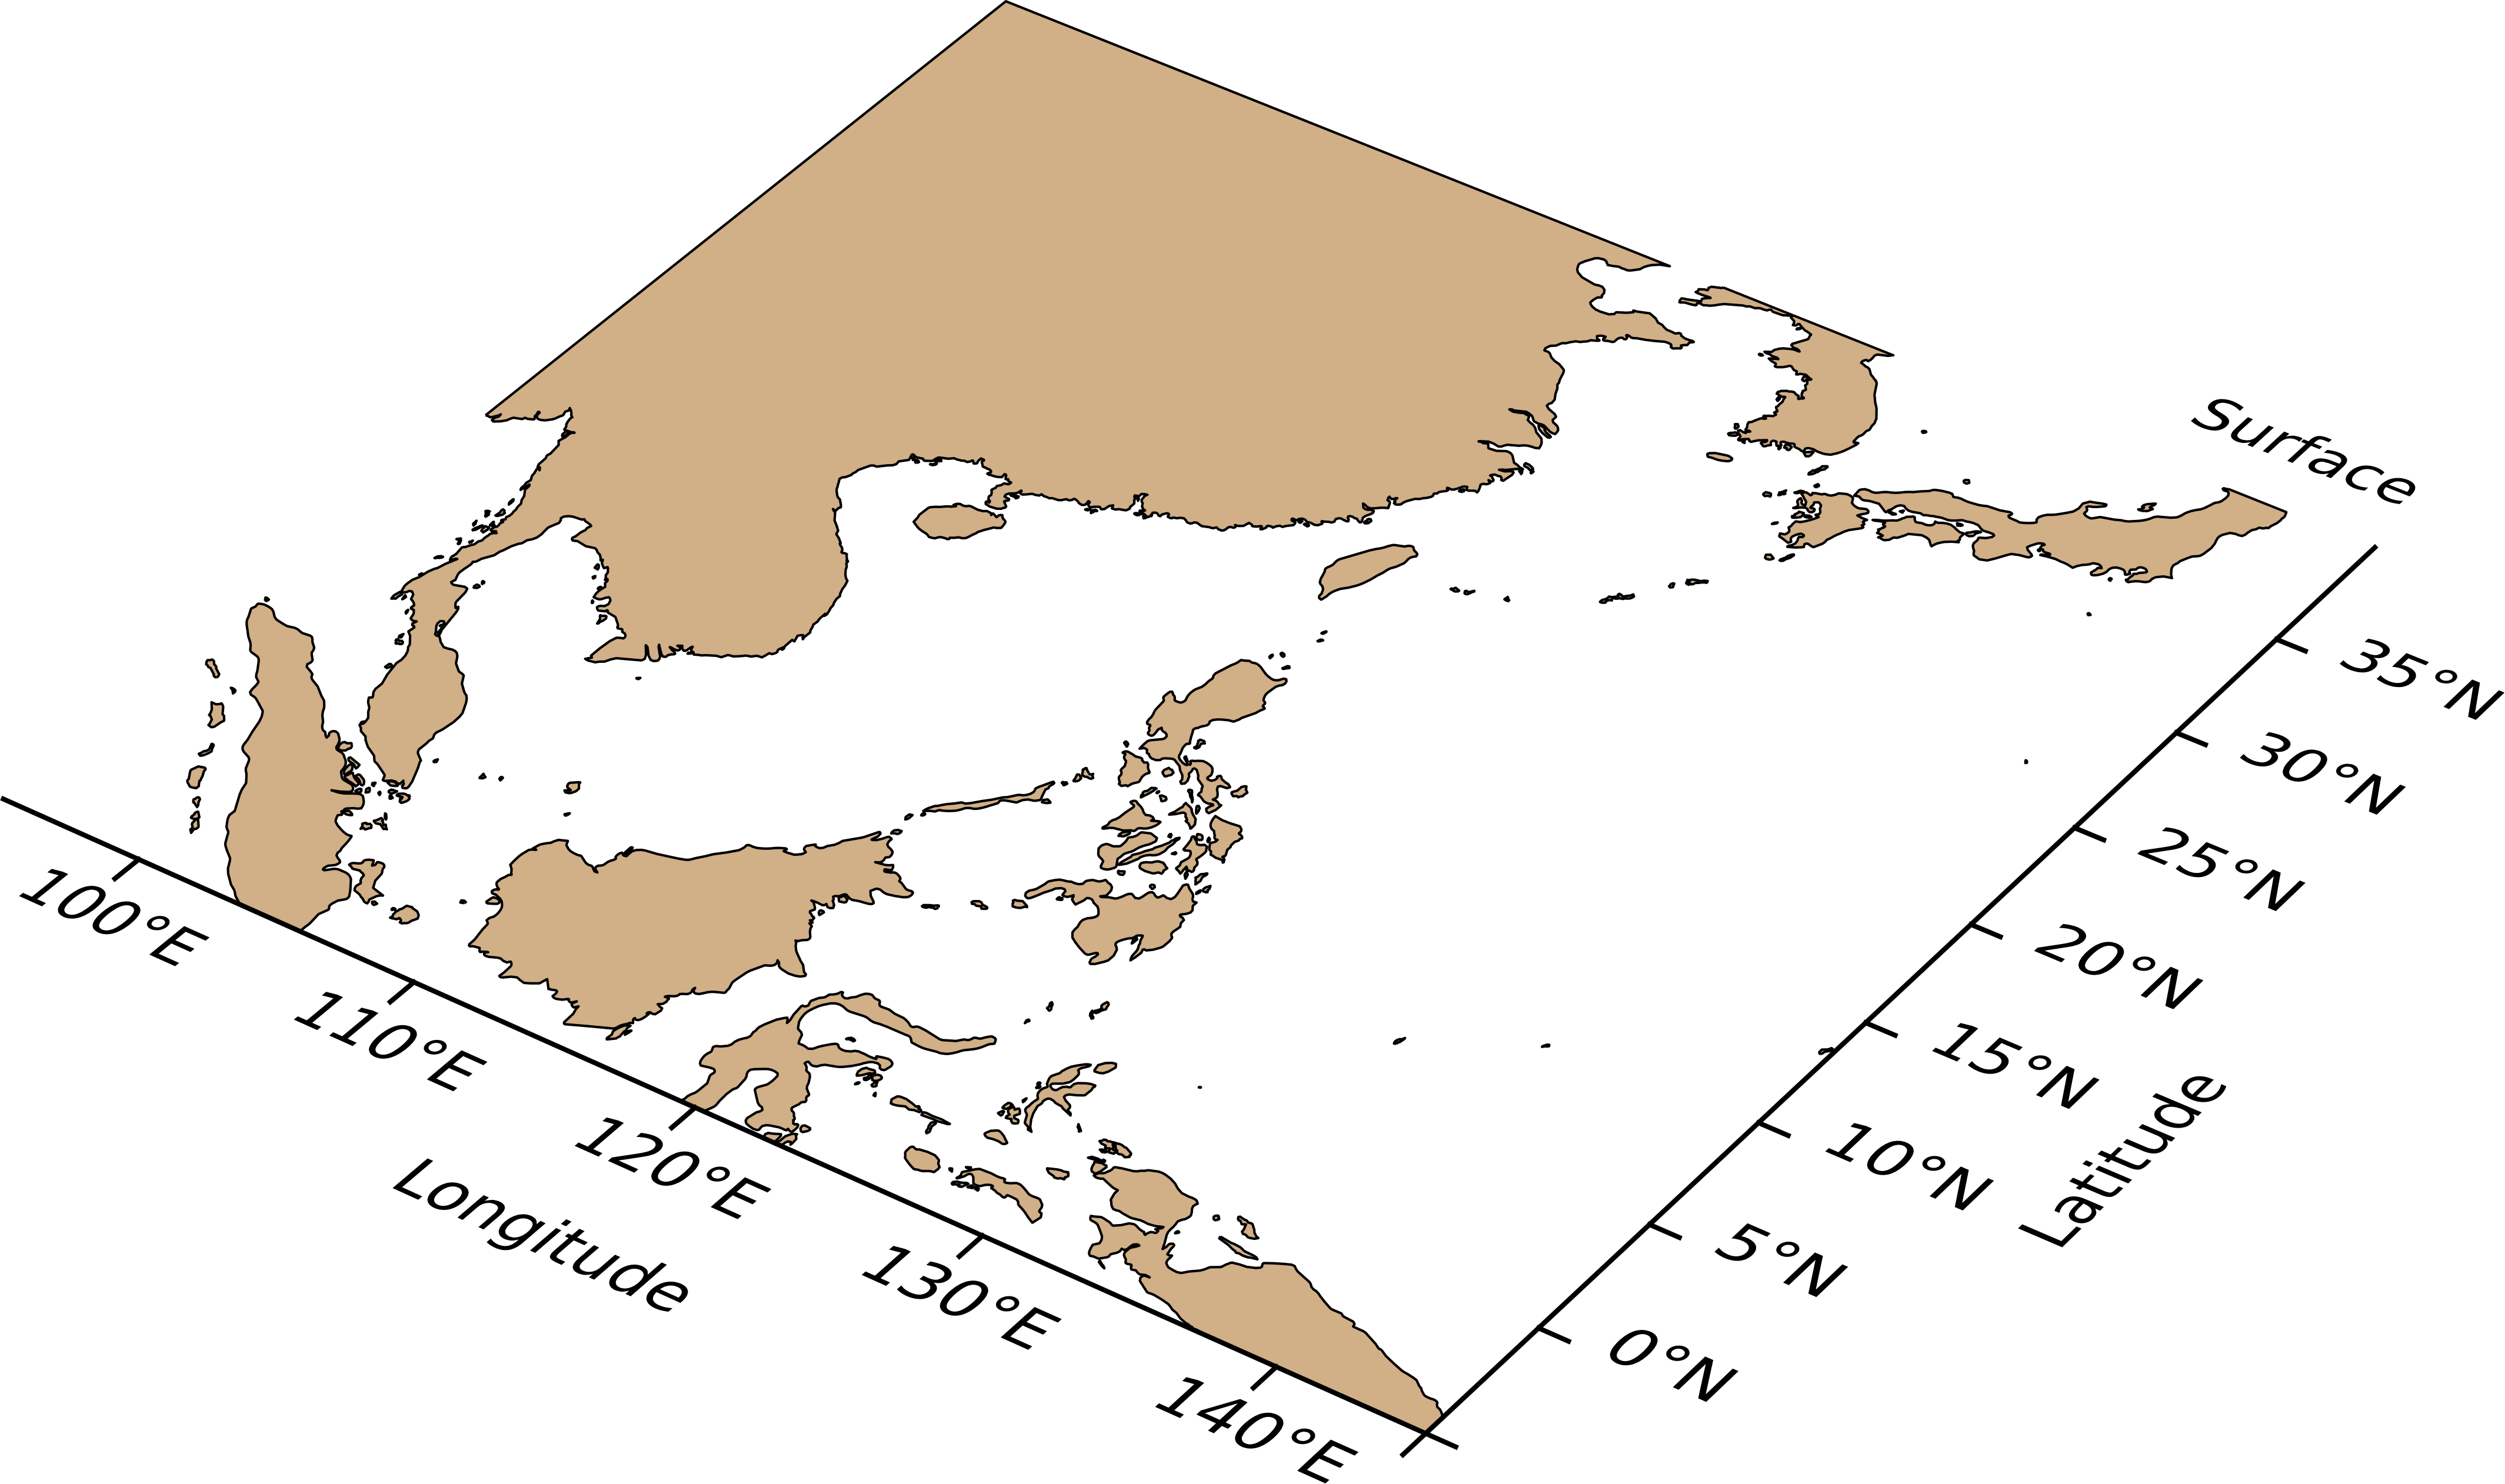
The final results as:
[1] 气象绘图加强版-三维地图
[2] 气象绘图编程|绘制复杂的三维地图
The examples and codes used in these Wechat articles refer to Stack Overflow
[1] python - 3D CartoPy similar to Matplotlib-Basemap - Stack Overflow
[2] python - contourf in 3D Cartopy - Stack Overflow
[3] cartopy - set_extent() extending requested boundary - Stack Overflow

