/jp

dead simple terminal plots from JSON data. single binary, no dependencies. linux, osx, windows.

Primary LanguageGoMIT LicenseMIT

jp

Dead simple terminal plots from JSON (or CSV) data. Bar charts, line charts, scatter plots, histograms and heatmaps are supported.

Build Status

Screenshot

Get it

go get -u github.com/sgreben/jp/cmd/jp

Or download the binary from the releases page.

# Linux
curl -LO https://github.com/sgreben/jp/releases/download/1.1.12/jp_1.1.12_linux_x86_64.zip
unzip jp_1.1.12_linux_x86_64.zip

# OS X
curl -LO https://github.com/sgreben/jp/releases/download/1.1.12/jp_1.1.12_osx_x86_64.zip
unzip jp_1.1.12_osx_x86_64.zip

# Windows
curl -LO https://github.com/sgreben/jp/releases/download/1.1.12/jp_1.1.12_windows_x86_64.zip
unzip jp_1.1.12_windows_x86_64.zip

Use it

jp reads JSON (or CSV) on stdin and prints plots to stdout.

Usage of jp:
  -type value
    	Plot type. One of [line bar scatter hist hist2d] (default line)
  -x string
    	x values (JSONPath expression)
  -y string
    	y values (JSONPath expression)
  -xy string
    	x,y value pairs (JSONPath expression). Overrides -x and -y if given.
  -bins uint
        Number of histogram bins (default 0 (auto))
  -input value
        Input type. One of [json csv] (default json)
  -height int
    	Plot height (default 0 (auto))
  -width int
    	Plot width (default 0 (auto))
  -canvas value
    	Canvas type. One of [full full-escape full-bw full-wb quarter braille auto] (default auto)

Examples

Bar chart

Separate X and Y values

$ < examples/tcp-time.json jp -x ..Label -y ..Count -type bar

         69
    █████████████
    █████████████
    █████████████
    █████████████
    █████████████
    █████████████      21
    █████████████ █████████████       7             2             1
    █████████████ █████████████ ▄▄▄▄▄▄▄▄▄▄▄▄▄ ▁▁▁▁▁▁▁▁▁▁▁▁▁ ▁▁▁▁▁▁▁▁▁▁▁▁▁

     46.85267ms    48.38578ms    49.91889ms     51.452ms     52.98511ms

XY pairs

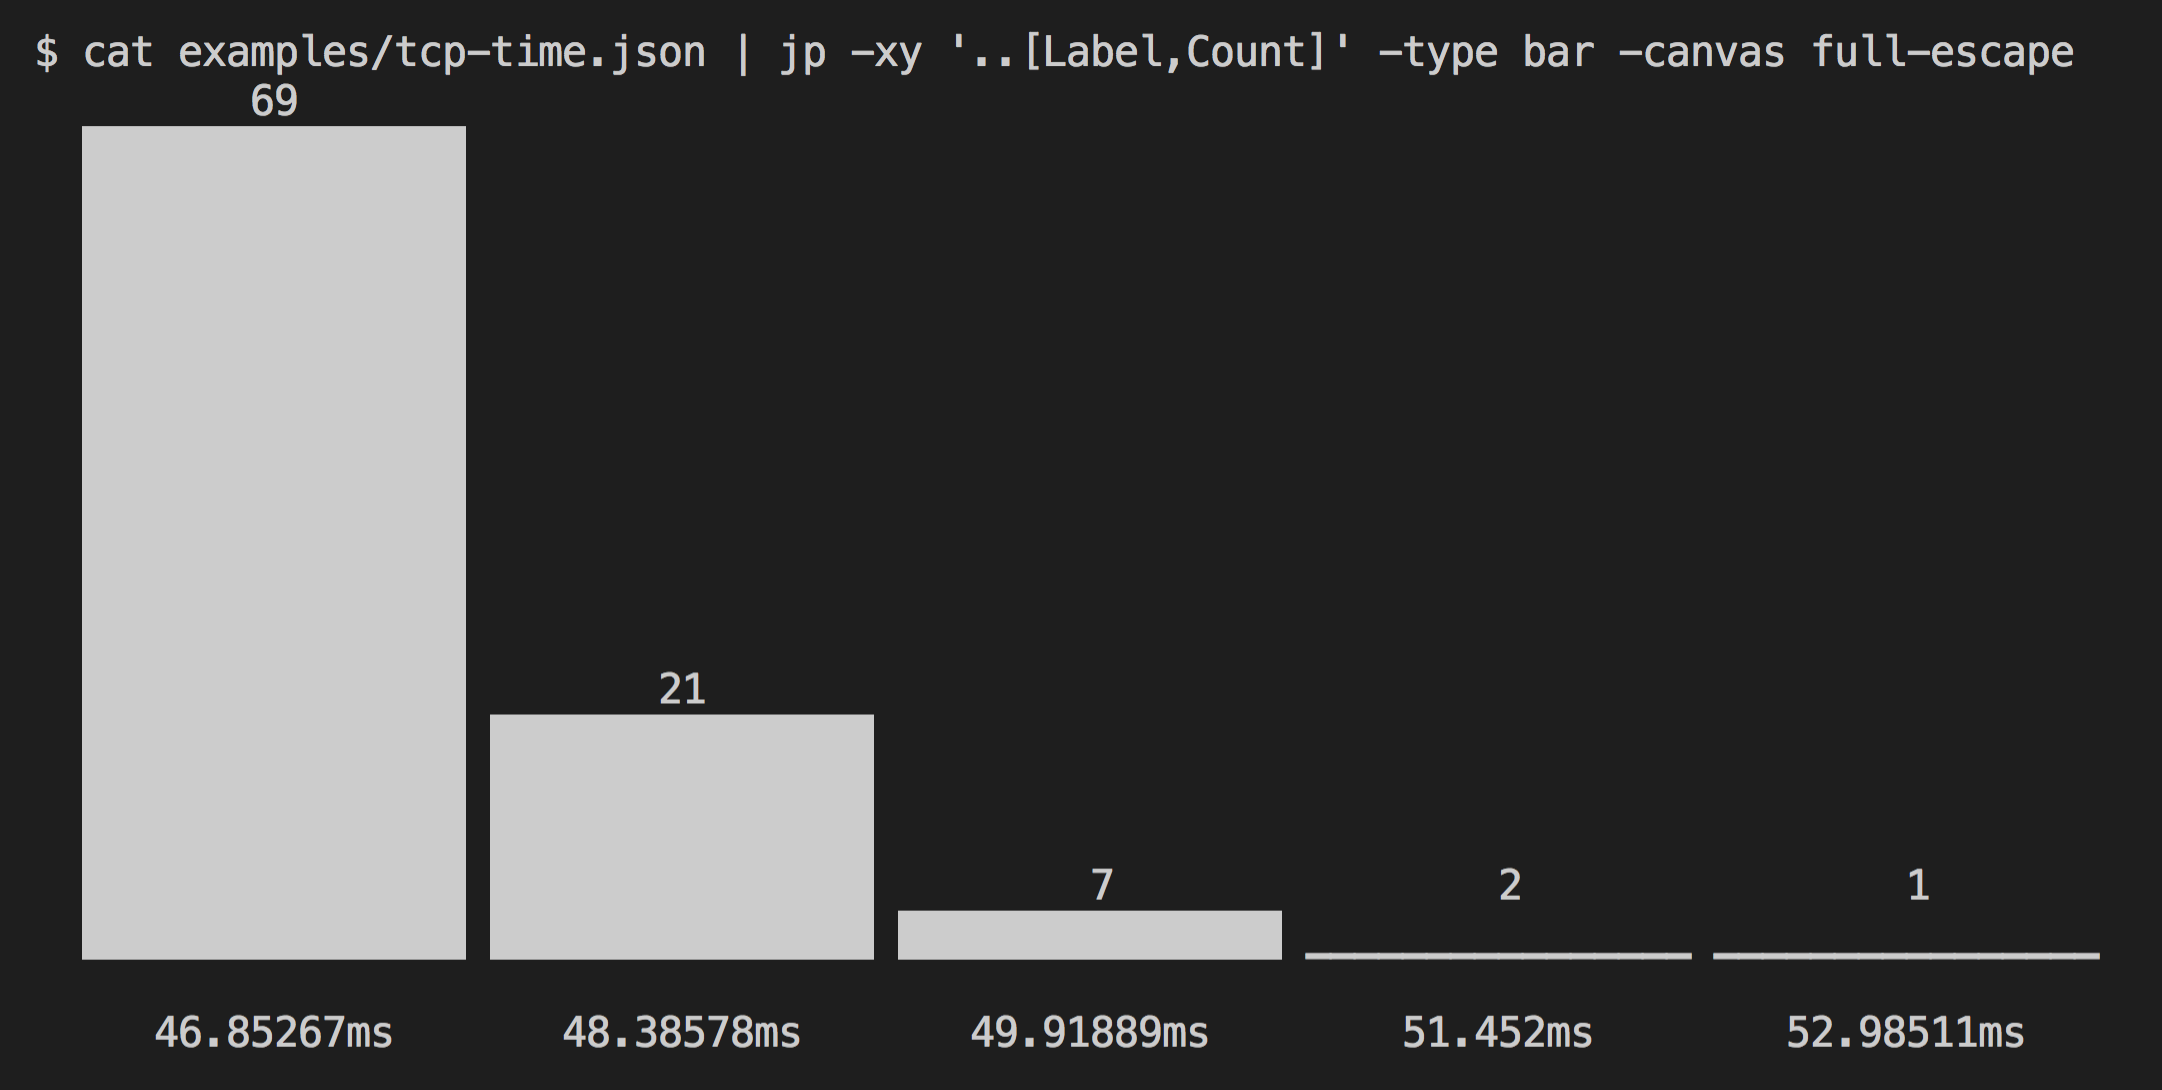
$ < examples/tcp-time.json jp -xy "..[Label,Count]" -type bar

         69
    █████████████
    █████████████
    █████████████
    █████████████
    █████████████
    █████████████      21
    █████████████ █████████████       7             2             1
    █████████████ █████████████ ▄▄▄▄▄▄▄▄▄▄▄▄▄ ▁▁▁▁▁▁▁▁▁▁▁▁▁ ▁▁▁▁▁▁▁▁▁▁▁▁▁

     46.85267ms    48.38578ms    49.91889ms     51.452ms     52.98511ms

Y values only (X=index)

$ < examples/tcp-time.json jp -y ..Count -type bar

         69
    █████████████
    █████████████
    █████████████
    █████████████
    █████████████
    █████████████      21
    █████████████ █████████████       7             2             1
    █████████████ █████████████ ▄▄▄▄▄▄▄▄▄▄▄▄▄ ▁▁▁▁▁▁▁▁▁▁▁▁▁ ▁▁▁▁▁▁▁▁▁▁▁▁▁

          0             1             2             3             4

Array data

$ echo '[[-3, 5], [-2, 0], [-1, 0.1], [0, 1], [1, 2], [2, 3]]' | jp -xy '[*][0, 1]' -type bar

         5
    ███████████
    ███████████
    ███████████                                                      3
    ███████████                                                 ▄▄▄▄▄▄▄▄▄▄▄
    ███████████                                          2      ███████████
    ███████████                              1      ███████████ ███████████
    ███████████                 0.1     ▄▄▄▄▄▄▄▄▄▄▄ ███████████ ███████████
    ███████████      0      ▁▁▁▁▁▁▁▁▁▁▁ ███████████ ███████████ ███████████

        -3          -2          -1           0           1           2

Line chart

Array data, separate X and Y values

$ jq -n '[range(200)/20 | [., sin]]' | jp -x '[*][0]' -y '[*][1]'
  1.059955│         ▄▄▄▖                                       ▗▄▄▄▖
          │       ▄▀▘  ▝▜▖                                   ▗▞▘   ▝▚
          │      ▟       ▝▄                                 ▗▀       ▜
          │     ▟         ▝▄                               ▗▀         ▜
          │    ▐           ▝▖                             ▗▞           ▚▖
          │   ▗▘            ▝▖                            ▞             ▚
          │  ▗▘              ▚                           ▞               ▌
          │  ▌                ▌                         ▗▘               ▝▖
          │ ▞                 ▝▖                        ▌                 ▚
          │▗▘                  ▚                       ▞                   ▌
          │▌                    ▌                     ▗▘                   ▝▖
          │                     ▝▖                   ▗▘                     ▐
          │                      ▐                   ▞                       ▚
          │                       ▚                 ▐                        ▝▖
          │                       ▝▖               ▗▘                         ▐
          │                        ▐               ▞                           ▚
          │                         ▀▖            ▐
          │                          ▚           ▄▘
          │                           ▙         ▗▘
          │                            ▚       ▄▘
          │                             ▚▄   ▗▞▘
          │                              ▝▀▀▀▘
 -1.059955└─────────────────────────────────────────────────────────────────────
          0                                                                 9.95

Array data, XY pairs

$ jq -n '[range(200)/20 | [., sin]]' | jp -xy '[*][0, 1]'
  1.059955│         ▄▄▄▖                                       ▗▄▄▄▖
          │       ▄▀▘  ▝▜▖                                   ▗▞▘   ▝▚
          │      ▟       ▝▄                                 ▗▀       ▜
          │     ▟         ▝▄                               ▗▀         ▜
          │    ▐           ▝▖                             ▗▞           ▚▖
          │   ▗▘            ▝▖                            ▞             ▚
          │  ▗▘              ▚                           ▞               ▌
          │  ▌                ▌                         ▗▘               ▝▖
          │ ▞                 ▝▖                        ▌                 ▚
          │▗▘                  ▚                       ▞                   ▌
          │▌                    ▌                     ▗▘                   ▝▖
          │                     ▝▖                   ▗▘                     ▐
          │                      ▐                   ▞                       ▚
          │                       ▚                 ▐                        ▝▖
          │                       ▝▖               ▗▘                         ▐
          │                        ▐               ▞                           ▚
          │                         ▀▖            ▐
          │                          ▚           ▄▘
          │                           ▙         ▗▘
          │                            ▚       ▄▘
          │                             ▚▄   ▗▞▘
          │                              ▝▀▀▀▘
 -1.059955└─────────────────────────────────────────────────────────────────────
          0                                                                 9.95

Y values only (X=index)

$ < examples/tcp-time.json jp -y ..Duration
 5.726165e+07│
             │
             │
             │
             │ ▗
             │ ▟
             │ █
             │▐▝▖
             │▐ ▌                                   ▌
             │▐ ▌                                   ▌
             │▌ ▌                                  ▐▚
             │▌ ▌                ▗       ▗         ▐▐    ▌
             │▘ ▌              ▖ ▐      ▞▀▖        ▐▐    ▌
             │  ▚   ▐▚  ▗▀▖   ▗▚ ▌▌    ▗▘ ▌ ▖▗▀▌   ▌▐    █
             │  ▐  ▛▌ ▚▖▞ ▚▐▖ ▞▐ ▌▌ ▗  ▐  ▐▟▐▞ ▚ ▗ ▌▝▖  ▐▐                      ▐
             │  ▐ ▐    ▝  ▝▌▝▀ ▝▟ ▚▗▜  ▞     ▘ ▐▖█▗▘ ▌  ▐▐    ▗  ▄▖     ▄▖      ▌▌
             │  ▝▚▐        ▘    ▘ ▐▘▝▖▄▌        ▝▝▟  ▀▀▚▟ ▌ ▖▞▘▌▐ ▚ ▗▄ ▐ ▚▄▖ ▄ ▄▘▌▞▄▄▀▚   ▄ ▄▗▞▖▞▄▄▚
             │   ▝▌                  ▛            ▌     ▝ ▙▞▝  ▝▘ ▝▚▘ ▀▘   ▝▀ ▀  ▐▘    ▚▞▀ ▀ ▘ ▚▘
             │
             │
             │
             │
 4.446018e+07└──────────────────────────────────────────────────────────────────────────────────────
             0                                                                                    99

Scatter plot

$ < examples/mvrnorm.json jp -xy '..[x,y]' -type scatter

 3.535344│                                 ⠄             ⠄
         │                               ⠈⠂   ⠂       ⡀ ⠂
         │                          ⠐⡀⡀⡂   ⠁  ⢄  ⠁ ⠠
         │                            ⡀    ⠆     ⠈  ⠄⡀        ⠂
         │           ⡀       ⠠  ⡀ ⡀ ⠄  ⡀⠐⠄⠁⠐ ⠠⢆⠠⠂⠂⠄⣀⢈  ⡀⠈ ⡀
         │                     ⡀⠂⠂⠄ ⡀⠂⢔⠠ ⢤⢀⠌⣡⠁⠦⠄⠐⡐⠂⣀⠅⠁⠈ ⠂ ⠈⠁⠁      ⡀     ⠄
         │  ⡀         ⢀  ⠄     ⠈⠠ ⠡⠑⠈⠈⢢⡁⡄⢈⠂⢡⠈⡄⡀⠈⠰⢉⡠⠘⢄⢃⠉⢀⣄⠢⠠⠄ ⠠ ⡀⠁ ⡀ ⠂
         │                   ⠈ ⡂⠈⡁⠈⠄⢂⡹⡐⡡⡆⡥⣙⡶⡼⠱⣅⣅⣼⢗⡱⢐⣈⠑⢁⠂ ⢐⢁⠭⠘⡀  ⠈
         │                ⠁ ⢀⠄⢈⠈⡰⢀⡥⠋⣧⣓⣚⡛⢲⣽⣝⣭⢙⣟⢲⡽⣋⡠⣿⣜⣵⠙⡦⠗ ⣡⠁⠁⠁⠄⠠ ⠄⡂
         │                  ⠄⠌⠌⠡⠉⡐⢯⣵⡏⢵⡞⠂⢰⣽⣷⢛⣯⡣⣷⢭⣞⣏⠤⣾⢡⡻⠢⢊⢠⡠⠸⢄⣃⡀⢁⠐ ⠐⡀ ⠂    ⠄
         │              ⠨ ⡈⠂ ⢀⢑⠄⣜⡾⣴⢨⠶⣪⣧⢿⣷⣷⡱⣿⣞⣲⣮⣮⣯⢾⡷⡬⡷⣺⠤⢏⡼⣨⢌⡬⠠⢂⢠⠒⠱⠆⡈
         │          ⠈  ⠃ ⠄⡐⠂⠐⢀⢈⣂⡈⣳⣷⣜⢺⣿⣹⣷⣼⣯⡿⣃⣽⣿⢾⣟⣾⢵⣻⠯⡼⡃⣼⣗⢲⠪⠇⣉⠺ ⢱⠠⠙⡀⢐⠌
         │          ⠄   ⠈⠊⠐⠑⠨⠚⢁⡊⢾⡶⢩⢿⣏⣽⢞⣼⣇⣵⣿⣿⣽⣿⢽⣭⠺⣿⣽⣳⢚⣾⣻⣾⣜⠩⡒⣃⠈⢢⠕⢂⢰⡀  ⡔⢀⢀    ⡀
         │            ⢀⠂⠁⠂⠇ ⠂⠊⢀⠐⡘⡍⡇⣚⢸⢟⣯⢿⣳⡪⣫⣵⣿⣯⣿⢿⣷⣻⣖⣗⣻⣚⢥⡷⣕⣏⠶⠊⠄⣠⠰⠂⡄⠂ ⠄⠁
         │             ⠠⢂ ⠘⠐⣀ ⣀⢡⢐⠔⢫⠯⢕⠫⠿⣹⢶⣾⡻⣭⣽⢗⠿⣹⣛⣺⣿⠯⢲⡼⣵⢉⣭⢐⣟⡍⠄⠈⠥⠄   ⠁   ⠄
         │             ⠈⠂  ⠊⡀⡈⠢⡌⡠⠖⢤⠥⡑⣯⣾⣴⣯⡿⣯⣝⣯⣿⠧⣽⣒⢾⣼⣻⣛⣗⡹⡽⢪⠯⠒⡨⠈ ⠈⡐⢄ ⠂⠘⠠        ⠂
         │              ⠰  ⡀⠃⠁⠠ ⠉⡈⡨⡱⢍⠌⠷⣯⠫⠬⡙⣴⣯⡣⡟⡮⠩⣫⠿⢞⢵⡰⠞⡂⠴ ⠕⢀⡂⠁ ⢀ ⠤   ⠈
         │               ⢩⠂ ⠁⡄ ⢀⠲⢂⠑⢁⡘⠄⠵⣣⢑⢻⠨⡩⣌⠕⢮⣮⣋⢹⡁⣊⡃⠈⡕⡘⡠⠨⠄⡘⠨ ⠊⠁   ⠂
         │          ⠐     ⢀ ⠈⠐⠔⠈  ⠁⢀⣀⡃⣊⢁⡘⠁⠛⠨ ⠒⡑⡀⠵⢙⠄⠡⠢⠃⠄⠋⠅ ⠥⠁⠠⢀ ⠄
         │                  ⢀⢁ ⠆   ⠉⠁⠐ ⠄⠁⢑⡀⢀⠠⠑⢡⢊⠂⠑⠌⡅⠊⠄⠉⢈⡐  ⡀ ⠠   ⠂
         │                      ⢀   ⠑ ⠂  ⡁ ⠌⢠⠈⠂⠄⠉⡃⠈⠄   ⠂⠠⠁ ⠄  ⢀ ⠠
         │                             ⠐ ⠐ ⢁⠂⠂⠢⠠⠄⠔⠐       ⠁
         │                         ⠢  ⠁    ⠂⠐  ⠐       ⠐   ⠈
         │                           ⢀  ⠄⠈       ⠈
         │                                        ⠐
         │
         │
         │                                      ⠈
-4.271874└─────────────────────────────────────────────────────────────────────
          -4.08815                                                       3.79083

Histogram

Auto bin number

$ < examples/mvrnorm.json jp -x ..x -type hist
                                    684                                     1  [-3.27033,-2.69856)
                                   █████▌                                   2  [-2.69856,-2.12679)
                                   █████▌ 624                               3  [-2.12679,-1.55502)
                                   ███████████                              4  [-1.55502,-0.983254)
                               557 ███████████                              5  [-0.983254,-0.411485)
                             ▐████████████████                              6  [-0.411485,0.160285)
                             ▐████████████████                              7  [0.160285,0.732054)
                             ▐████████████████                              8  [0.732054,1.30382)
                             ▐████████████████                              9  [1.30382,1.87559)
                             ▐████████████████ 404                          10 [1.87559,2.44736)
                             ▐█████████████████████▌                        11 [2.44736,3.01913)
                         314 ▐█████████████████████▌                        12 [3.01913,3.5909]
                        ▄▄▄▄▄▟█████████████████████▌
                        ███████████████████████████▌
                        ███████████████████████████▌
                        ███████████████████████████▌
                        ███████████████████████████▌ 176
                        █████████████████████████████████
                    98  █████████████████████████████████
                  ▐██████████████████████████████████████ 79
    1     4   41  ▐███████████████████████████████████████████  14    4
  ▁▁▁▁▁▁▁▁▁▁▁█████████████████████████████████████████████████▁▁▁▁▁▁▁▁▁▁▁

    0     1    2     3    4     5    6     7    8     9   10    11   12

Fixed bin number

$ < examples/mvrnorm.json jp -x ..x -type hist -bins 5
                                         1652
                                    █████████████████
                                    █████████████████
                                    █████████████████
                                    █████████████████
                                    █████████████████
                                    █████████████████
                                    █████████████████
                                    █████████████████
                                    █████████████████
                                    █████████████████
                                    █████████████████
                                    █████████████████       728
                                    ██████████████████████████████████
                          541       ██████████████████████████████████
                   ▄▄▄▄▄▄▄▄▄▄▄▄▄▄▄▄▄██████████████████████████████████
                   ███████████████████████████████████████████████████
                   ███████████████████████████████████████████████████
                   ███████████████████████████████████████████████████
                   ███████████████████████████████████████████████████
         22        ███████████████████████████████████████████████████       57
  ▁▁▁▁▁▁▁▁▁▁▁▁▁▁▁▁▁███████████████████████████████████████████████████▄▄▄▄▄▄▄▄▄▄▄▄▄▄▄▄▄

  [-3.8421,-2.3555)[-2.3555,-0.8689)[-0.8689,0.6177)  [0.6177,2.1043)  [2.1043,3.5909]

2D Histogram (heatmap)

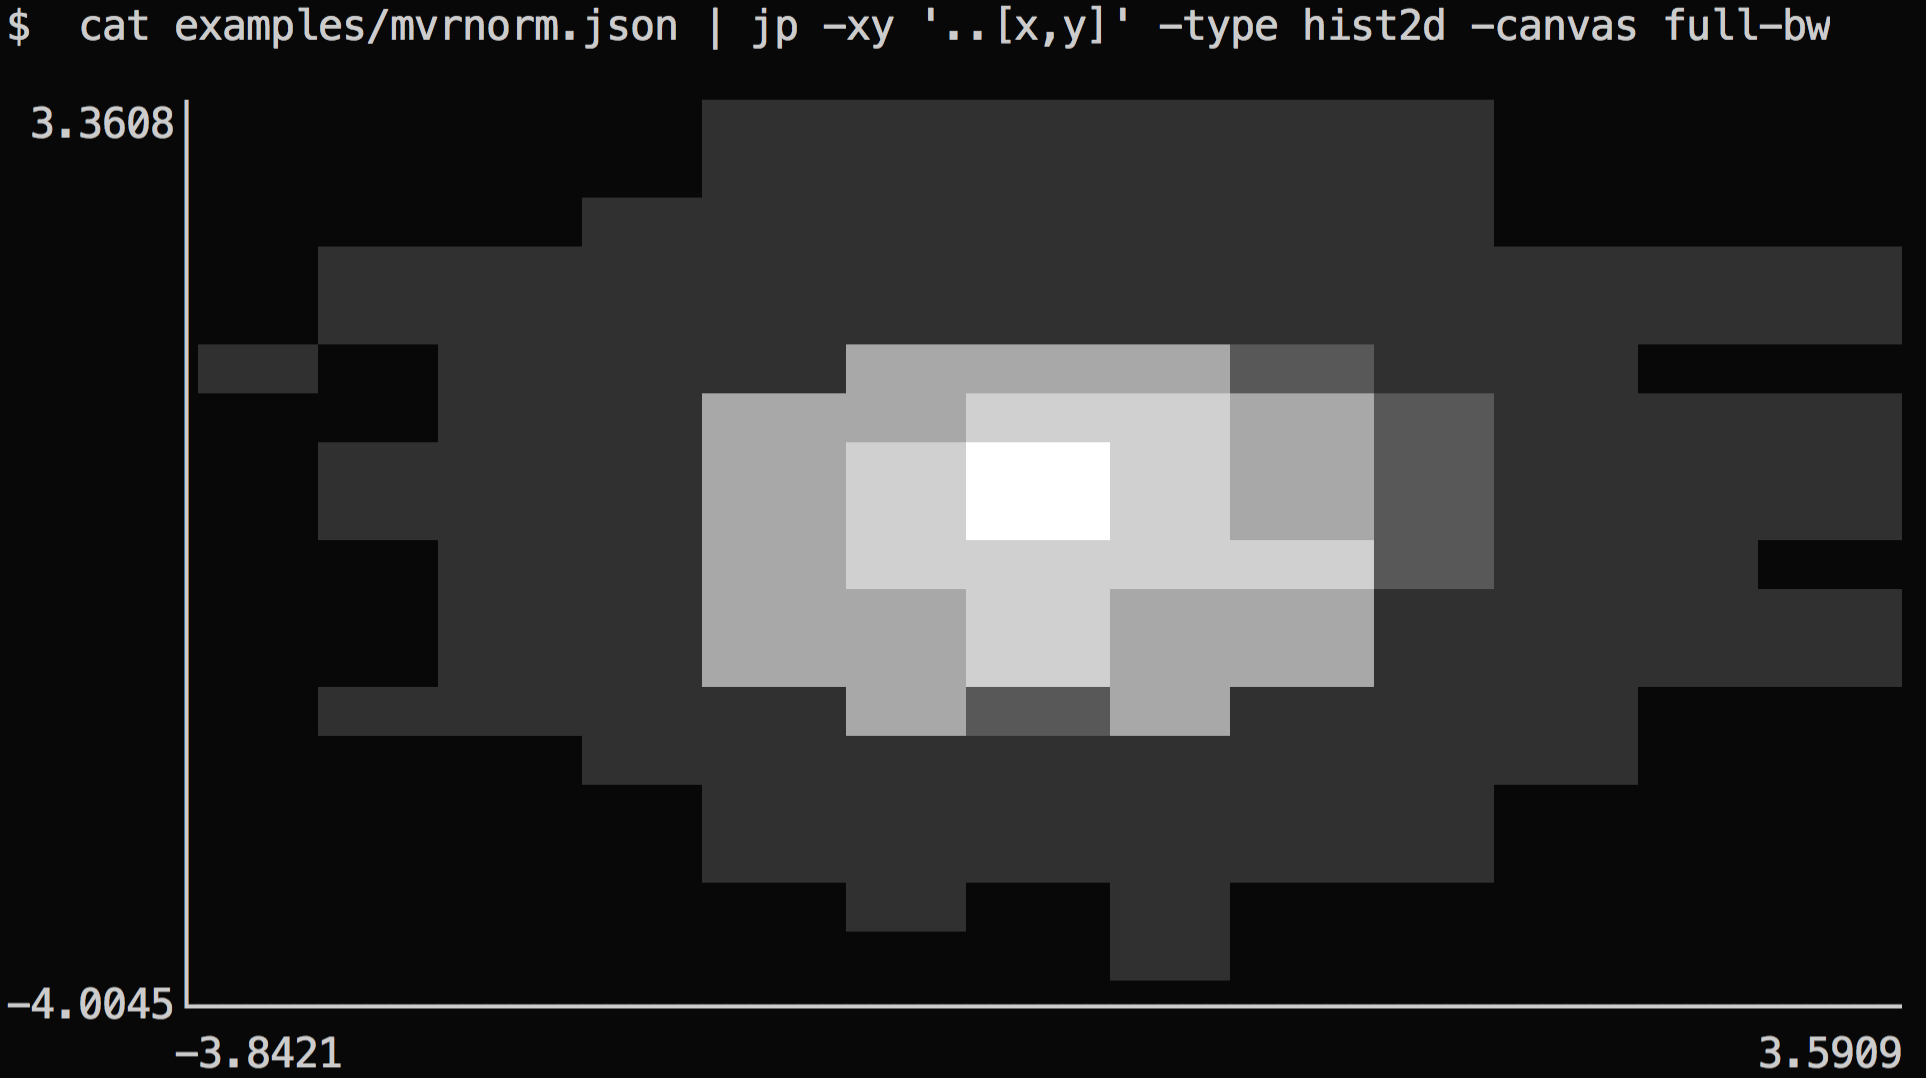
$ < examples/mvrnorm.json jp -xy '..[x,y]' -type hist2d

  3.3608│                   ····    ········    ····
        │                   ····    ········    ····
        │                   ····    ········    ····
        │                   ················    ····
        │                   ················    ····
        │           ································
        │           ································
        │       ················░░░░░░░░░░░░················
        │       ················░░░░░░░░░░░░················
        │       ············▒▒▒▒▓▓▓▓▒▒▒▒▒▒▒▒░░░░············
        │       ············▒▒▒▒▓▓▓▓▒▒▒▒▒▒▒▒░░░░············
        │···············▒▒▒▒▒▒▒▒▓▓▓▓▓▓▓▓▓▓▓▓▒▒▒▒············
        │···············▒▒▒▒▒▒▒▒▓▓▓▓▓▓▓▓▓▓▓▓▒▒▒▒············
        │       ········░░░░▓▓▓▓▓▓▓▓████▓▓▓▓▒▒▒▒············
        │       ········░░░░▓▓▓▓▓▓▓▓████▓▓▓▓▒▒▒▒············
        │       ········░░░░▓▓▓▓▓▓▓▓████▓▓▓▓▒▒▒▒············
        │   ············▒▒▒▒▒▒▒▒▓▓▓▓▓▓▓▓▒▒▒▒▒▒▒▒············
        │   ············▒▒▒▒▒▒▒▒▓▓▓▓▓▓▓▓▒▒▒▒▒▒▒▒············
        │       ············▒▒▒▒▒▒▒▒▒▒▒▒▒▒▒▒················
        │       ············▒▒▒▒▒▒▒▒▒▒▒▒▒▒▒▒················
        │           ····································
        │           ····································
        │               ····························
        │               ····························
        │               ····        ····        ····
        │               ····        ····        ····
        │                                   ····
        │                                   ····
 -4.0045└───────────────────────────────────────────────────
        -3.8421                                       3.5909

JSONLines input

If your data consists of whitespace-separated JSON values (known as JSONLines for newline separators), you can use the -s ("slurp") mode of jq to aggregate your data points into a single array before passing it to jp:

$ echo "[0,1]" "[1,2]" "[2,3]" | jq -s . | jp

 3.16│
     │                                                   ▄▄▀
     │                                               ▄▄▀▀
     │                                           ▄▄▀▀
     │                                      ▗▄▄▀▀
     │                                  ▗▄▞▀▘
     │                              ▗▄▞▀▘
     │                          ▗▄▞▀▘
     │                      ▗▄▞▀▘
     │                  ▗▄▞▀▘
     │              ▗▄▞▀▘
     │           ▄▄▀▘
     │       ▄▄▀▀
     │   ▄▄▀▀
     │▄▀▀
 0.94└──────────────────────────────────────────────────────
     0                                                     2

CSV input

$ < examples/sin.csv jp -input csv -xy '[*][0,1]'

  1.059955│       ▗▄▛▀▀▚▄▖                                    ▄▄▀▀▀▄▄
          │     ▗▞▘      ▝▚▖                                ▄▀      ▝▀▄
          │    ▟▘          ▝▄                             ▗▀          ▝▀▖
          │  ▗▛              ▚▖                          ▞▘             ▝▙
          │ ▄▘                ▀▖                        ▞                 ▚
          │▞▘                  ▝▌                     ▗▛                   ▚▖
          │                     ▝▚                   ▐▘                     ▝▄
          │                       ▜▖                ▟▘                       ▝▄
          │                        ▐▄             ▗▞                          ▝▚
          │                          ▚▖          ▄▀
          │                           ▀▙▖      ▄▛
          │                             ▀▀▄▄▄▞▀▘
 -1.059955└─────────────────────────────────────────────────────────────────────
          0                                                                 9.95

Screenshots

Scatter plot

Bar chart

Bar chart

Line chart

Heatmap

Licensing