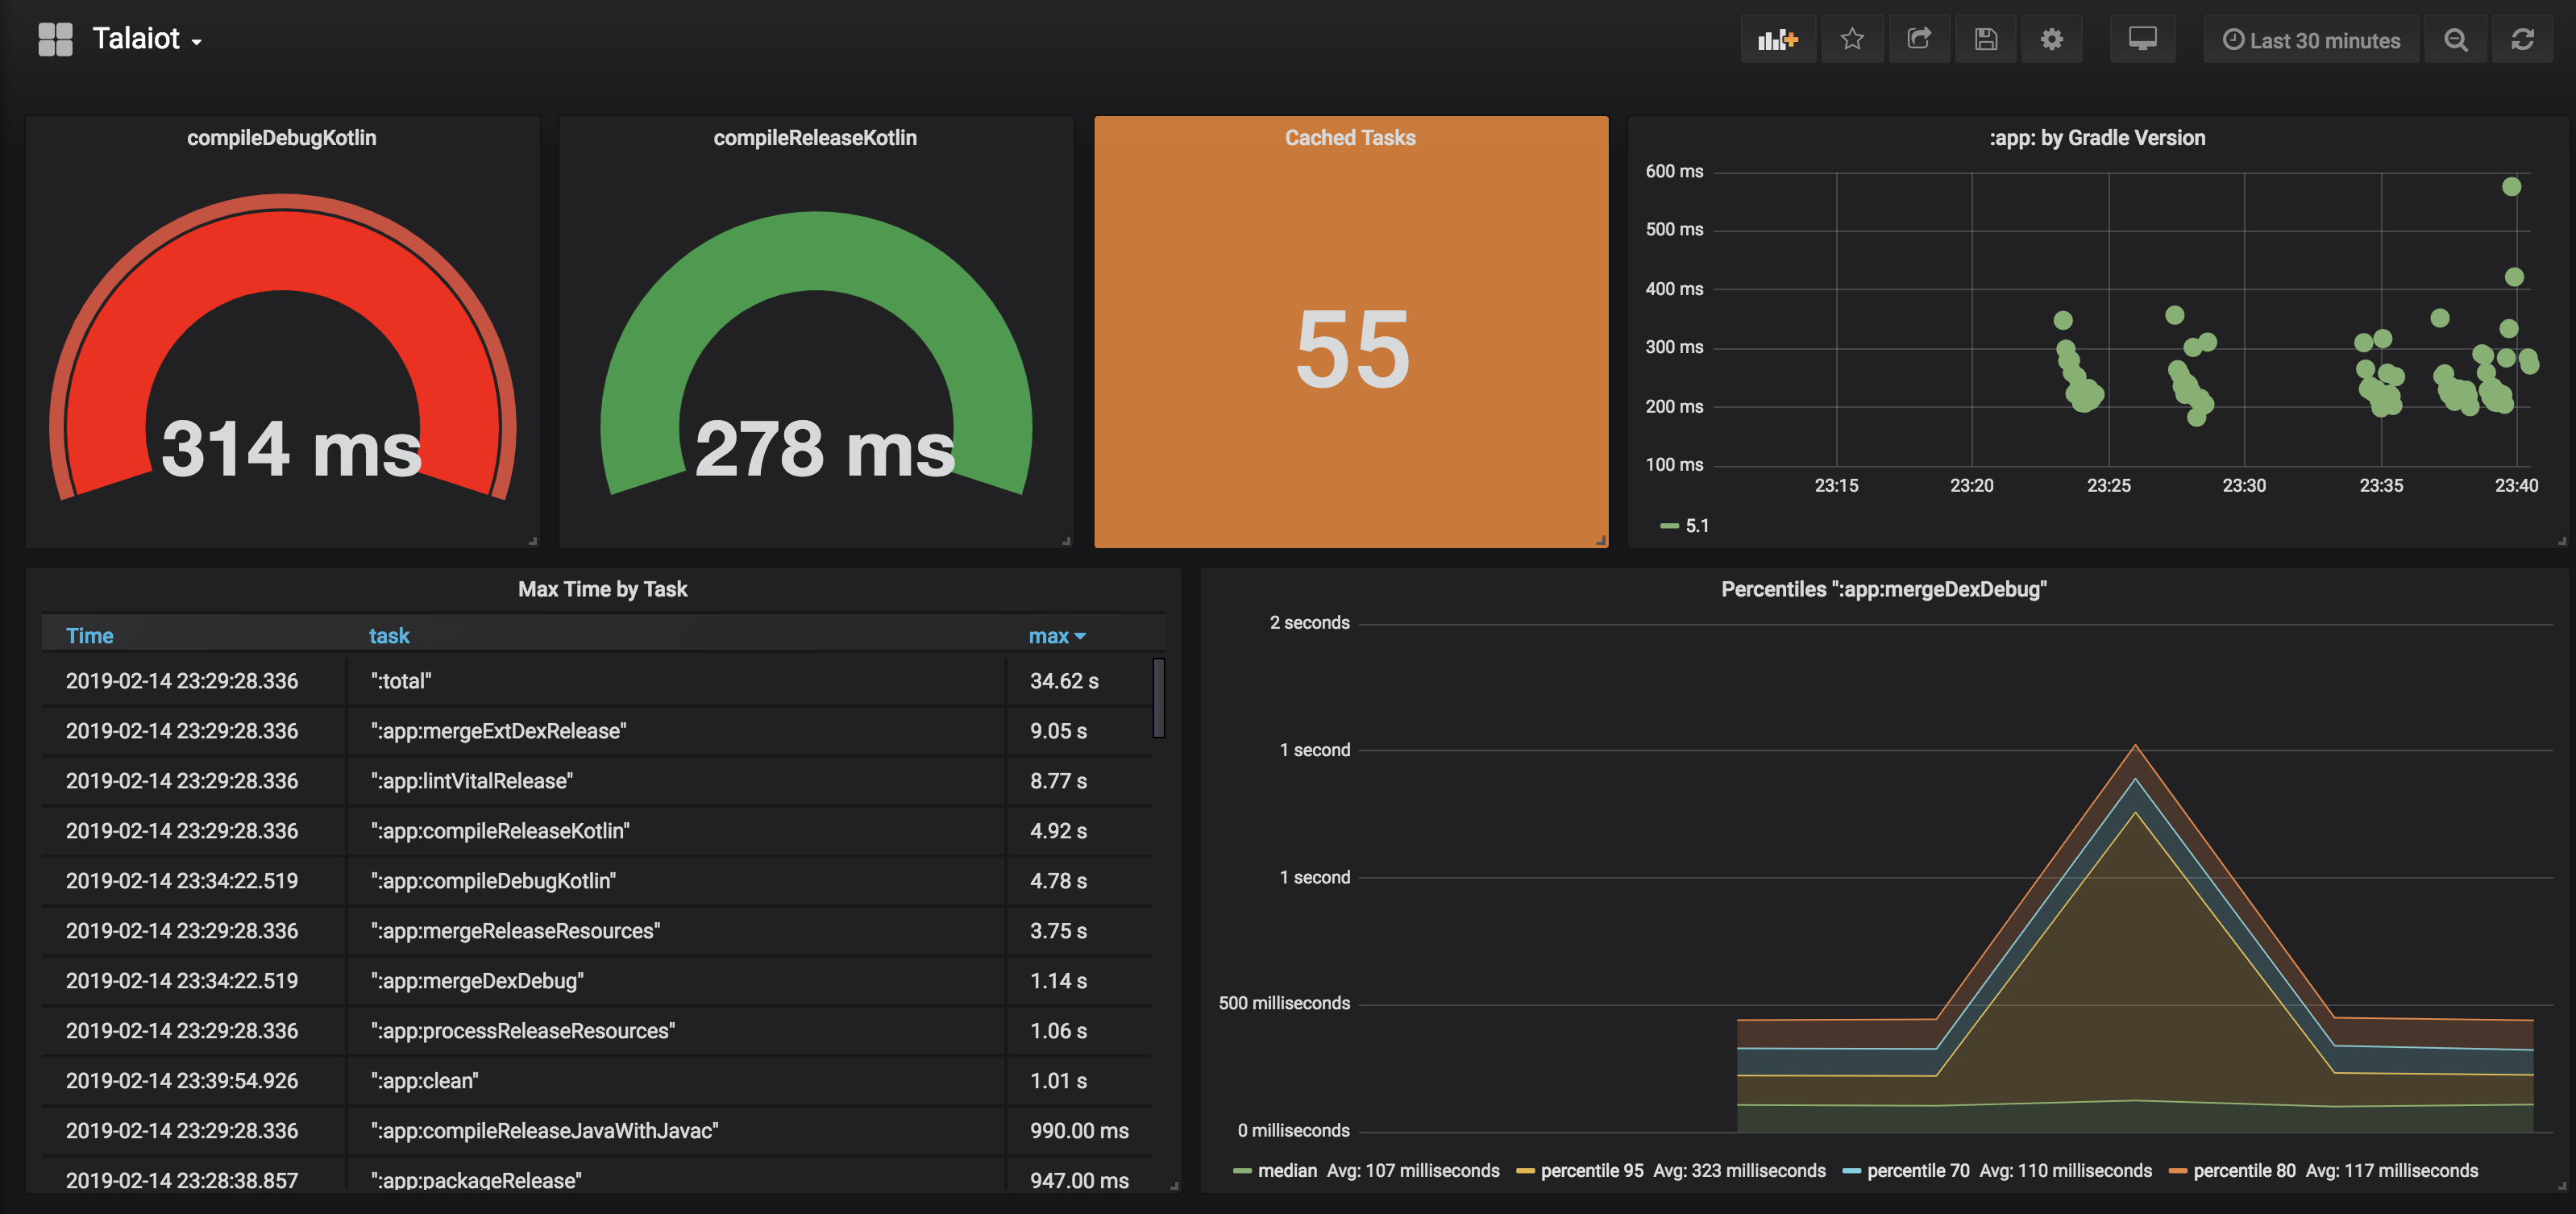
Talaiot is a simple and extensible plugin targeting teams using Gradle Build System. It records the duration of your Gradle tasks helping to understand problems of the build and detecting bottlenecks. For every record, it will add additional information defined by default or custom metrics.
Some of the features are:
- Integration with Time/Series systems
- Extensible definition of metrics depending on the requirements.
- Definition of custom publishers
- Develop it entirely with Kotlin
What is Talaiot?
"... while some certainly had a defensive purpose, the use of others is not clearly understood. Some believe them to have served the purpose of lookout or signalling towers..."
https://en.wikipedia.org/wiki/Talaiot
Include in the classpath the latest version of Talaiot:
classpath("com.cdsap:talaiot:<latest_version>")
Apply the plugin:
plugins {
    id("talaiot")
}
Check this article to see how to setup Talaiot with Groovy(all the examples in the README are in KTS.
talaiot {
    publishers {
        influxDbPublisher {
            dbName = "tracking"
            url = "http://localhost:3003"
            urlMetric = "tracking"
        }

    }
    metrics {
        gitMetrics = false
        performanceMetrics = false
    }
}
This example adds the InfluxDbPublisher with the information of the InfluxDb Server where it will be posted the information tracked.
Additionally, we are disabling the metrics for Git and Performance.
| Property | Description |
|---|---|
| logger | Mode for logging (Silent,Info) |
| ignoreWhen | Configuration to ignore the execution of Talaiot |
| generateBuildId | Generation of unique identifier for each execution(disabled by default) |
| publishers | Configuration to define where to submit the information of the build |
| metrics | Additional information tracked during the execution of the task |
In terms of publishing Talaiot includes some default Publishers, but at the same time you can extend it and create your publisher for your requirements
| Property | Description |
|---|---|
| OutputPublisher | Publish the results of the build on the console, this Publisher will only print the task name and duration |
| InfluxDbPublisher | Publish the results of the build to the InfluxDb database defined in the configuration |
Talaiot will send to the InfluxDb server defined in the configuration the values collected during the execution
| Property | Description |
|---|---|
| dbName | Name of the database |
| url | Url of the InfluxDb Server |
| urlMetric | Name of the metric used in the execution |
Talaiot allows using custom Publishers defined by the requirements of your environment, in case you are using another implementation. Check here how to define a custom publisher
For every measurement done, Talaiot adds metrics to help you later to analyze the data and detect problems. Metrics are categorized by different configurations. The Default Configuration of Metrics includes:
| Property | Description |
|---|---|
| baseMetrics | Collects information about the project, build, OS Id and user |
| gitMetrics | Metrics related to the Git configuration of the project |
| performanceMetrics | Metrics related to the Java arguments defined on the Gradle Build. |
| gradleMetrics | Metrics related to Gradle arguments |
By default all the metrics are available but if you want to disable some group define the configuration like:
  metrics {
        gitMetrics = false
        perfomanceMetrics = false
  }
Check the Wiki to know more about the existing metrics
If you need to add more information on the builds you can add more metrics under the customMetrics on the MetricsConfiguration
talaiot {
    metrics {
        customMetrics( "versionApp" to $version,
                       "customProperty" to getCustomProperty()
                      )
    }
}
| Property | Description |
|---|---|
| envName | Name of the Property |
| envValue | Value of the Property |
We will use IgnoreWhebn when we want to ignore publishing the results of the build. One use case is to ignore it when we are building on CI:
talaiot {
    ignoreWhen {
        envName = "CI"
        envValue = "true"
    }
}
To have a quick setup to see the possibilities of Talaiot we are providing a Docker image to setup a Grafana + Inlfluxdb instances(based on this great repo).
Additionally, the Docker image is creating a default database, a provisioned dashboard and the default datasource for InfluxDb. The source is here:
To run the Docker Image:
docker run -d \
  -p 3003:3003 \
  -p 3004:8083 \
  -p 8086:8086 \
  -p 22022:22 \
  -v /var/lib/influxdb \
  -v /var/lib/grafana \
  cdsap/talaiot:latest
You can access to the local instance of Grafana:
http://localhost:3003 root/root
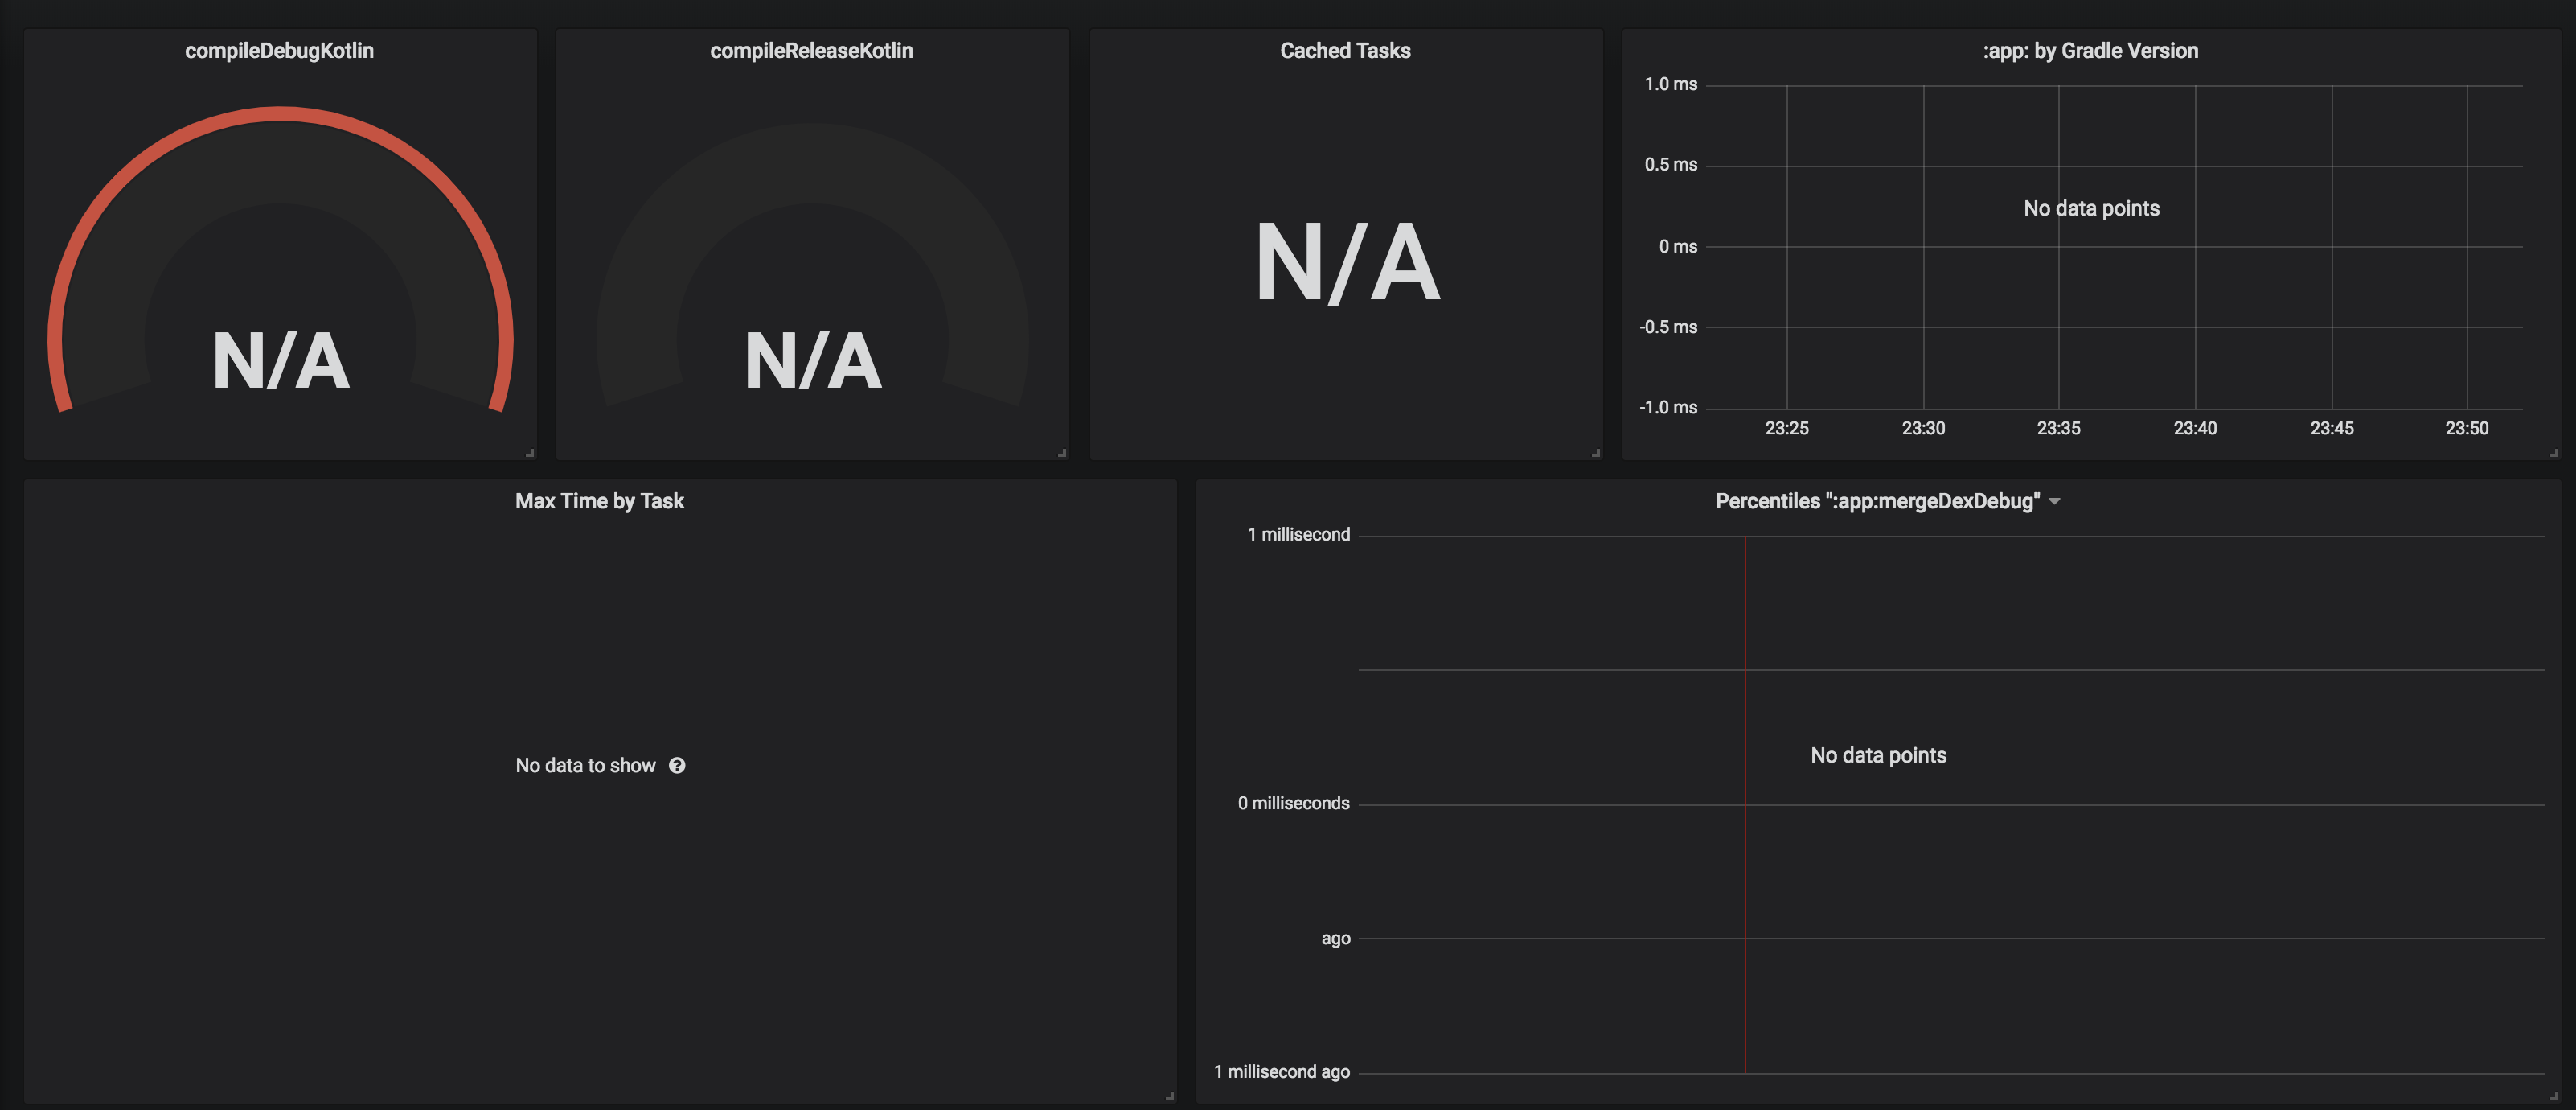
If you access to the provisioned Dashboard included in the Docker Image(http://localhost:3003/d/F9jppxQiz/android-task-tracking?orgId=1), you will see an empty dashboard like:
To see Talaiot in action, you need to populate the data. We are providing a script to populate data based in this example repository: https://github.com/cdsap/TalaiotClientExample
This repository includes the InfluxDbPubluser configuration pointing to the InfluxDb and datastore defined in the Docker image:
talaiot {
    publishers {
        influxDbPublisher {
            dbName = "tracking"
            url = "http://localhost:3003"
            urlMetric = "tracking"
        }

    }
}
You can execute the script:
bash scripts/populate.sh
The script will download the repository and with the help of Gradle Profiler(https://github.com/gradle/gradle-profiler) will trigger number of builds defined in the scenario file:
    assemble {
    tasks = ["clean"]
    }
    clean_build {
    versions = ["5.1","4.10.2"]
    tasks = ["assembleDebug"]
    gradle-args = ["--parallel"]
    cleanup-tasks = ["clean"]
    run-using = cli
    warm-ups = 20
    }
Once is finished you can check the results on the Grafana Dashboard http://localhost:3003/d/F9jppxQiz/android-task-tracking?orgId=1
Talaiot is not a new idea. There are multiple awesome plugins to use to achieve same results:
-
Gradle Enterprise: If you are using Gradle Enterprise Talaiot is useless because the aggregation is great and you have the support from Gradle :)
-
Build Time Tracker by Pascal Hartig(@passy).
-
Kuronometer Plugin developed with Scala and FP concepts by Pedro Vicente Gómez Sánchez(@pedrovgs)
Talaiot is Open Source and accepts contributions of new Publishers, Metrics and Dashboards that we can include as provisioned ones in the Docker image.
Pascal Hartig, Build Time Tracker it was an inspiration to build this plugin.


