Welcome to making your very first processor :) (or second for former 6.004 students)
In the file pipelined.bsv fill out the mkpipelined module to implement a 4-staged pipelined mini-riscv processor (inspired by the lecture). To start, we provide a multicycle pipelined implementation in multicycle.bsv with several useful code chunks which you will almost entirely re-use in your implementation (it is expected you copy/paste most of the rules as a starting point).
At the beginning of pipelined.bsv we define structs for the data to store between stages. These should be useful for you but feel free to to change them if needed for your design.
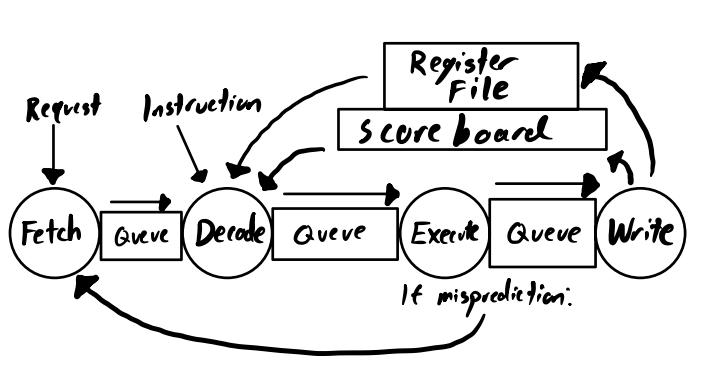
As a refresher, a pipelined processor has queues between each stage. Mispredictions should be identified if program counter predictions do not match up with the actual next program counter, and dealt with by neither sending a memory operation nor pushing the instruction to Writeback (and so never update the register file). Also, it is notable that a scoreboard must be implemented to deal with read-after-write and write-after-write data hazards. Typically you can simply use 32 register (or EHRs) holding a single boolean tracking if there is any outstanding write the corresponding register. You may find the following diagram to be useful:
Here is an overall picture of the design you should build:
This lab is longer so start early. You have 1.5 weeks to complete it, due March 5 at 9:30am, with the checkoff due after OH on March 11.
Lectures 5 and 6 will crucial for this lab.
You will need to fill in the four pipeline stages in pipelined.bsv -- fetch, decode, execute, and writeback. These should function as described in the lecture notes. Please make a full sketch of your design ahead of time as this will help you debug.
Fetch should fetch the next instruction, with prediction of pc+4. Decode should run the given function decoder and store state. Execute runs the execute function (ALU, branching, etc). Writeback writes the updated state back to the register file and/or memory.
Keep in mind that because of memory latency and other issues, these stages can take multiple cycles and your code should include appropriate stalling logic to wait for results. You should also be keeping guards to make sure data hazards are checked. Appropriate bypassing can be used with the EHRs as registers.
We provide a series of queues that are controlled with methods to send and recieve memory requests. These are toImem/fromImem, toDmem/fromDmem, and toMMIO/fromMMIO. The FIFO queue interface has three methods that can be used: .enq(word), .deq() , and .empty (bool). These are connected to BRAM in the test bench that you do not need to worry about.
We already provide the decode and execute functions. Reference multicycle.bsv for usage.
You will need to use konata (see below) to prove that your processor is pipelined correctly.
Run make all first. then....
We have a collection of a few tests: add32, and32, or32, hello32, thelie32, mul32, ... (see the full list in test/build/)
To run one of those tests specifically you can do:
For the code we give you...
./run_multicycle add32 # Will run add32 on the multicycle core
Or for your code....
timeout 2 ./run_pipelined add32 # Will run add32 on your future pipelined processor, it is often useful to add a timeout to avoid running forever
Those will generate a trace multicycle.log or pipelined.log that can be opened in Konata (see below).
You can also run all the tests with:
./test_all_multicycle.sh
./test_all_pipelined.sh
All tests but matmul32 typically take less than 2s to finish. matmul32 is much slower (30s to 1mn).
(For enrichment)
Your processor gets its instructions from its memory, and its memory is loaded from the mem.vmh file. Our test script moves a prebuilt RISC-V hex file from the test/build directory into mem.vmh and then calls the simulator that runs the top file that corresponds with whichever processor you're testing. If you're using the run_<something>.sh scripts, they also convert the intermediate Konata logs into a human-readable Konata log, which is how you see things like li a0 0 in the Konata visualization.
If you want to produce your own tests, you can do two things:
- Write your own RISC-V assembly and compile it into an
elf - Write your own C code and compile it into RISC-V
elf
then convert that elf into a hex file, hence the elf2hex tool we have in the directory. (Note: run make clean; make in the elf2hex directory before use if not on Linux amd64). We don't expect you'll need to produce any tests yourself, but they are here if you want them.
If you do make your own tests, feel free to share the hex files on the Piazza. We have a rather boring and minimal set of tests, and I'm sure your peers would be delighted to see whatever fun tests you cook up! But it is not necessary for the lab.
When debugging/interacting with your processor, it may be useful to use a visualization tool called 'Konata'. Konata can be installed from here using your preferred method of installation for your OS. Arm based Macs should be able to use intel 64bit software in emulation without problem -- if this doesn't work let us know and we can try to recompile it from scratch for arm.
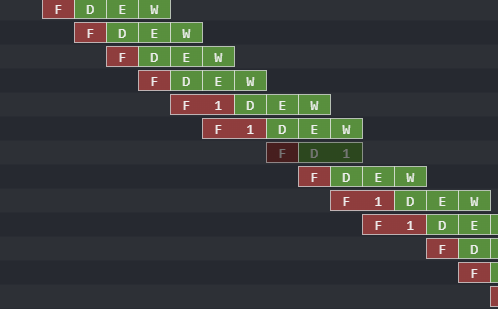
Konata can then be used on produced '.log' files (generated when you run your benchmarks) to generate a visualization of when 'Fetch', 'Decode', 'Execute' and 'Write' are called among other useful information. Specifically, Konata tells you the step you are on, the thread, retirement number, program counter, instruction bits, both potential registers, the type of instruction, and the ALU output. We produce an output.log as a byproduct, but you should be reading from multicycle.log and pipelined.log since they are slightly more human-readable.
You can already use Konata to visualize the execution of the baseline multicycle design, it should look like:
Once you will have implemented your pipelined processor successfully, the Konata visualization should look like:

To use Konata, you will have to generate event in each of the rule of your design. You can study multicycle.bsv as an example.
In the skeleton code of pipelined.bsv we also gave some sketch of how to generate those events.
Remark: With those event created, the testbench output large log, put in .log. Those log can grow quickly, so you should not let a processor that does not complete a benchmark run for too long (no more than 60 seconds). This is the reason why we use the timeout command in the previous paragraph.
At the very least you will need:
let iid <- fetch1Konata(lfh, fresh_id, 0);   // allocates a unique ID for the log corresponding to this instruction; makes the F box
decodeKonata(lfh, current_id);
executeKonata(lfh, current_id);
writebackKonata(lfh,current_id);
These four instructions place the little boxes on the visualization. They should be placed in each of the four respective stages in your pipeline for appropriate Konata output. You don't want to end up in a situation where your log doesn't correspond to the behavior of your design.
Open either multicycle.log or pipelined.log in Konata for the corresponding visualization.
To add debug messages in konata, you can use labelKonataLeft(lfh,current_id, $format(" My debug message ")); in any stage you want to display in the left side panel in Konata. You can also do mouse-over messages with labelKonataMouse(File f, KonataId konataCtr, Fmt s);. See the details in the KonataHelper.bsv, where we have provided all of the Konata infrastructure necessary.
A Fmt object is like a debug string. You can use $format exactly the same as you would use $display; the difference is only that $format places it in a Fmt object and $display does an Action with it.
We provide binaries for a tool called spike-dasm for you if you are on an Arm/Intel Mac or Intel/AMD linux/wsl machine. This tool processes the konata log for you to generate human readable assembly code in the log. If you are on a different architecture for some reason, it will default to not processing the logs.
- Alternatively, you can compile it yourself from here. You will need to do
sudo apt install device-tree-compileron Debian/WSL orbrew install dtcon mac (intel or arm). Then run./configure; make spike-dasm. Copy your newspike-dasmfile totools/in the lab repository (replace the existing file).
All the tests are written in C, you can find the source in "test/src/*.c".
For each test, we also provide the assembly code produced by the compiler in a *.dump file.
For example, for the test add32 the assembly code is available in test/build/add32.dump.
While debugging a design, it is very common to have side-by-side: the processor-execute trace (either just as a sequence of display statement printed in the terminal, or the fancier version of using Konata), and the corresponding assembly code listing in a text editor. This is to understand the moment where things go in an unexpected way: maybe the problem is caused by a branch, maybe an instruction get stuck forever in the decode stage (identifying which one it is might help doing a good diagnostic), etc... The key to debugging is to first gather as much data as possible, and then walk through the debugging data gathered slowly. Start debugging your processor on simple tests before going to more complicated ones.
These tests are programmed in C and are in the tests directory. If you really want to compile your own tests, you will need to install riscv64-unknown-elf-gcc for your operating system (e.g. sudo apt-get install gcc-riscv64-unknown-elf on Debian). Edit the makefile to add your code. This is certainly not needed for the lab, only for fun or to debug :)
For the register file and the scoreboard, we advise you to use a vector of EHRs (or registers initially), like what you did in Lab 2a. Remember that EHRs will allow you to read in the same cycle that you write. This is crucial for bypassing in a pipelined processor when dealing with the hazards. You can see an example for how we initialize the register file in multicycle.bsv.
make submit will run the autograder and upload your code. Please keep a konata screenshot (just a segment of one test will be fine) inside your repository when you are done.
Let us know on Piazza or OH if you need any help :)
You can use regular git commit to backup any changes you make but make sure your last commit is passing tests and uploaded using make submit. You should commit and push regularly as a good coding practise.

