Jenning Chen, Ashwin Srinivasan, Cindy Yang, Lisa Yoo
Link to our visualization
Link to our video
Link to our paper
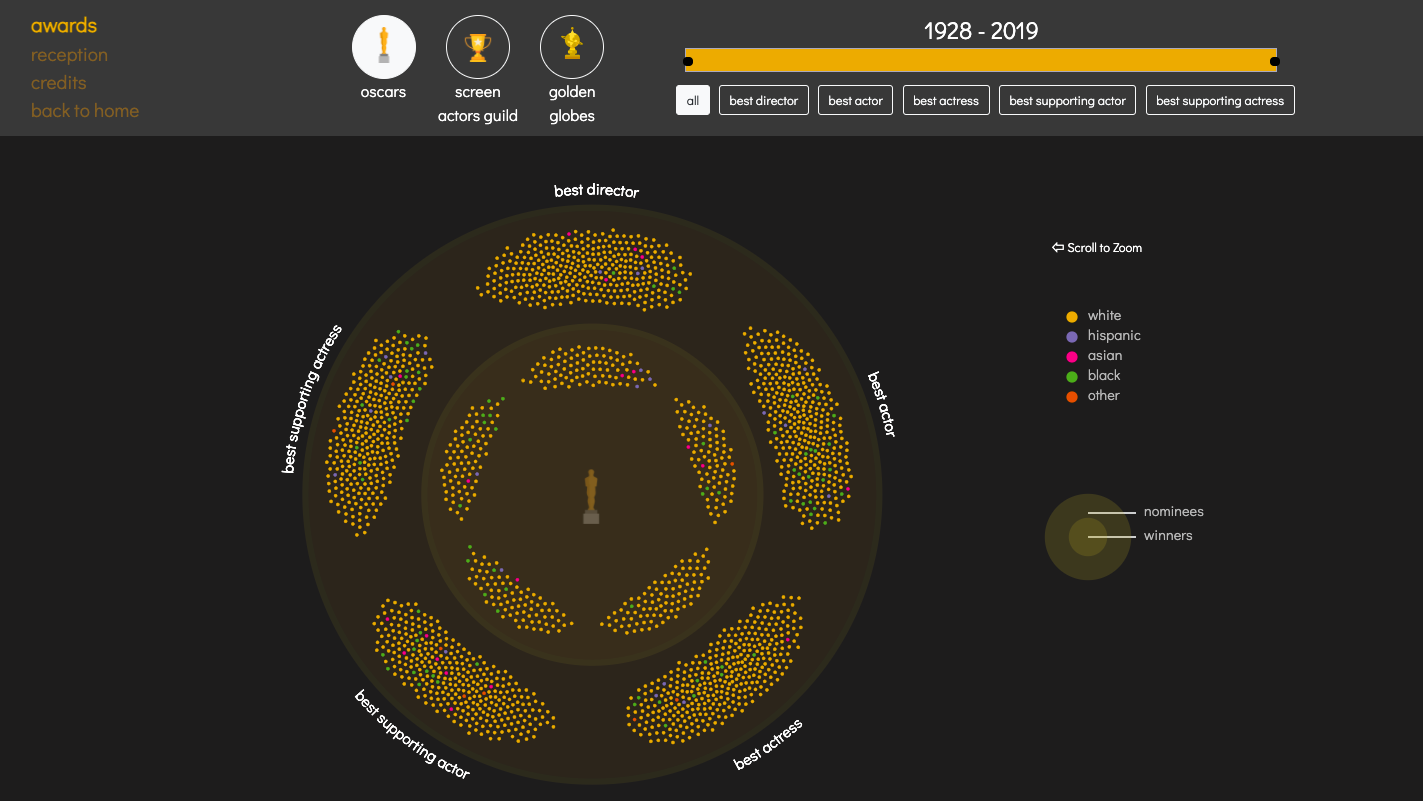
Inspired by the #OscarsSoWhite movement in 2015, our visualization experience empowers users to explore diversity in Hollywood, and how the distribution of race and ethnicity relate to different measures of success: movie reception and awards. We bring together datasets on major awards (Oscars, Golden Globes, Screen Actors' Guild) and box office statistics and create digestible visualizations to see how white Hollywood really is.
Clone the repository. In the terminal, run python -m http.server. Navigate to http://localhost:8000/ to view the landing page.
The contributions made by each team member are listed below.
- Aided in gathering datasets and scraped supplementary data for actor races
- Worked with Lisa to brainstorm and develop the reception bubble plot
- Designed the home page
- Reformatted and restyled the awards cluster graph visualization
- Added cluster graph visualization for Screen Actors Guild
- Helped create the line graphs on awards pages
- Helped style the awards cluster graph visualization
- Added cluster graph visualization for Golden Globes
- Helped create the line graphs on awards pages
- Helped style the awards pages
- Created dropdown autocomplete search bar
- Implemented and styled reception comparison visualization
- Helped preprocess movies dataset
- Initial reception page styling & bubble plot
For our final project, we chose to extend the work we'd done for A4 because we thought there was still much to explore. We began by brainstorming potential extensions and additional visualizations to build on the narrative we already had, which included the new perspective of box office reception, inclusion of other acting/directing award datasets, and extra visualizations to better break down our awards datasets. Ashwin + Cindy worked on the awards page, while Jenning + Lisa worked on the reception page -- the process for each team was to gather/scrape datasets, spec out visualizations, then implement.
D3 code references: https://www.d3-graph-gallery.com/, https://dev.to/nenadra/how-to-make-a-search-box-with-a-dropdown-in-javascript-4j9p
Data and images retrieved from:
- Oscars: data.world
- Golden Globes: kaggle
- SAG: kaggle
- Race data: NNDB,
- Top movies metadata: boxofficemojo.com, kaggle
- Industry-wide data: datausa.io
- Movie posters: TMDB
