Project exploring the mobility patterns in Chicago, Los Angeles, New York City, and San Francisco. The work leverages GPS point data scraped from cellphone/device applications. The works focuses on pattern detection and comparison across cities, network topology of mobility networks through clustering, and node-edge volume/mode prediction using machine learning.
- Colin Bradley
- Yuxuan Cui
- Abdullah Kurkcu
- Jianwei Li
- Minqui Lu
- Kaan Ozbay
- Karan Saini
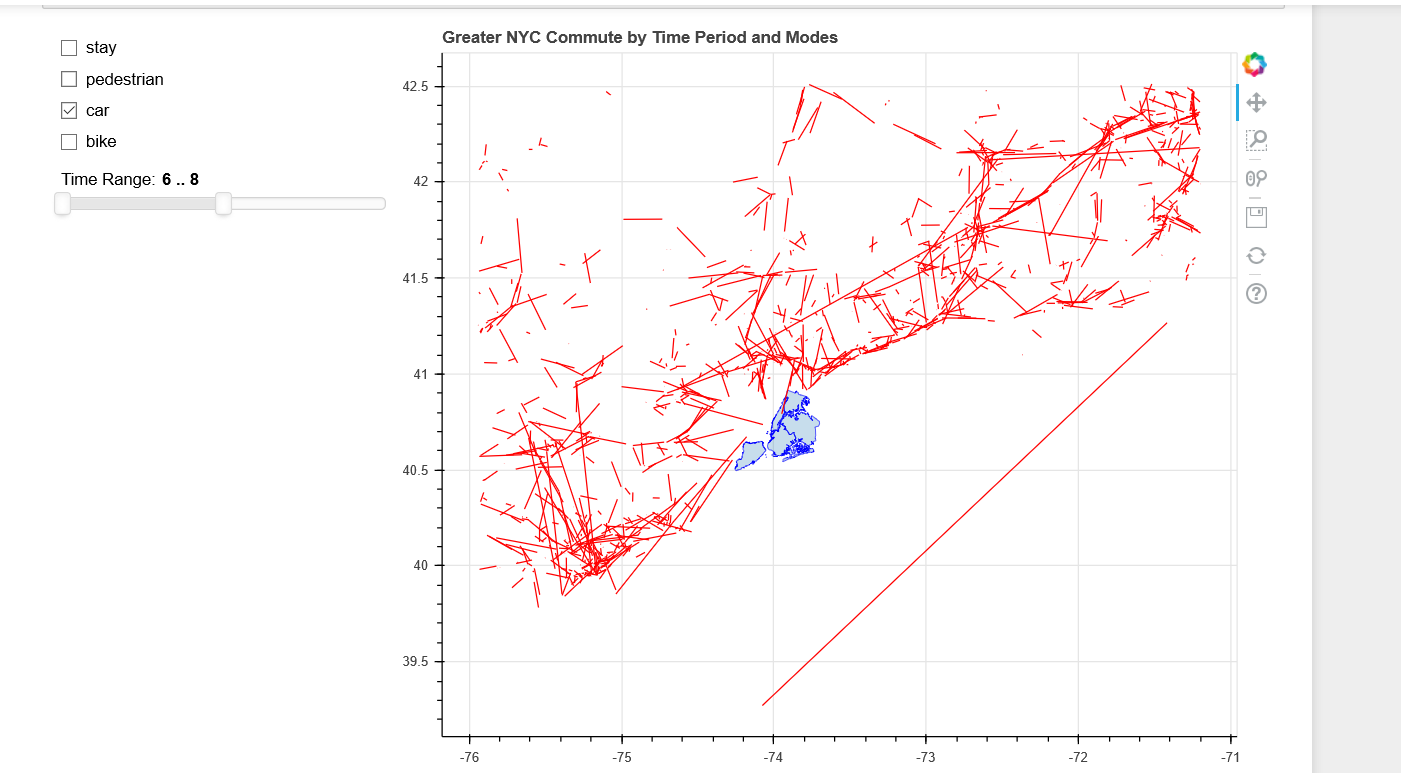
- Interactive tools to visualize mobility patterns.
- Data is cleaned and filtered data and not the entire raw data.
- Data aggregated at different levels for various plots.
- Please refer to github link for details.
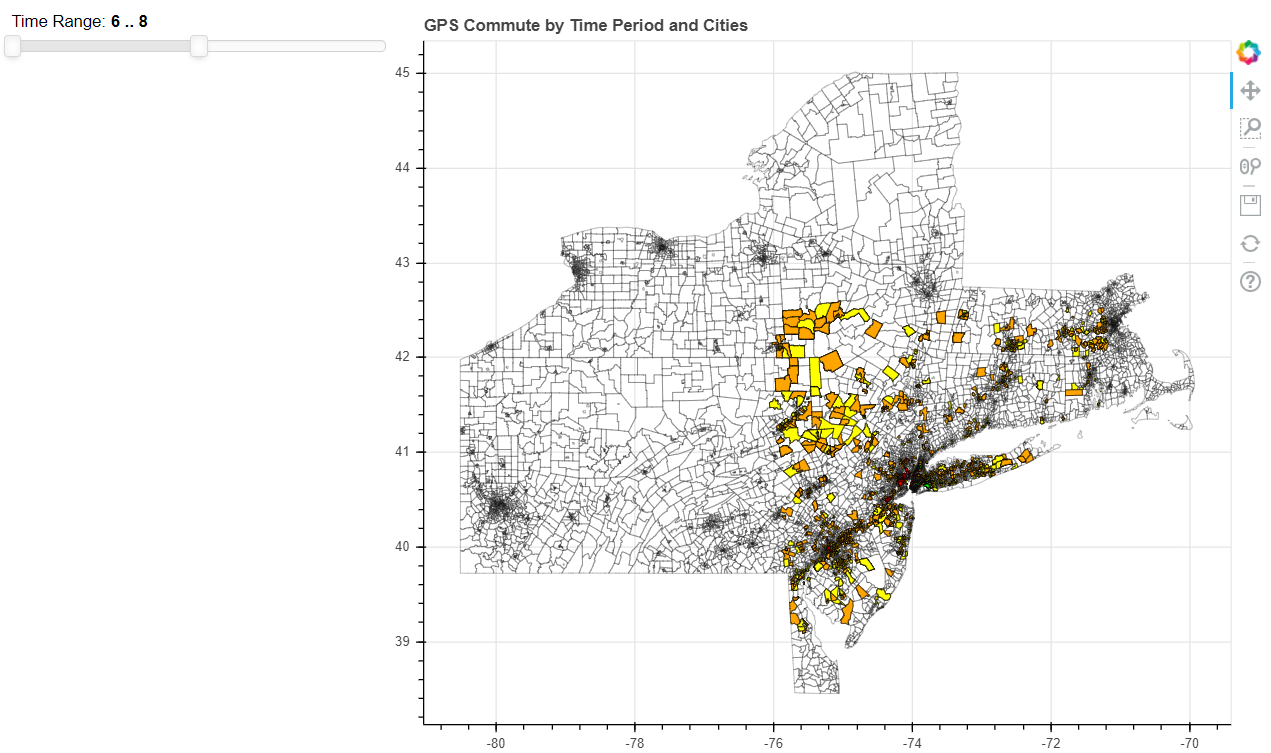
- Interactive tools for EDA to check data quality.
- Data is sponsor provided raw data.
- Data aggregated at CT level for all plots.
- Please refer to python notebooks with same name as plots for details.
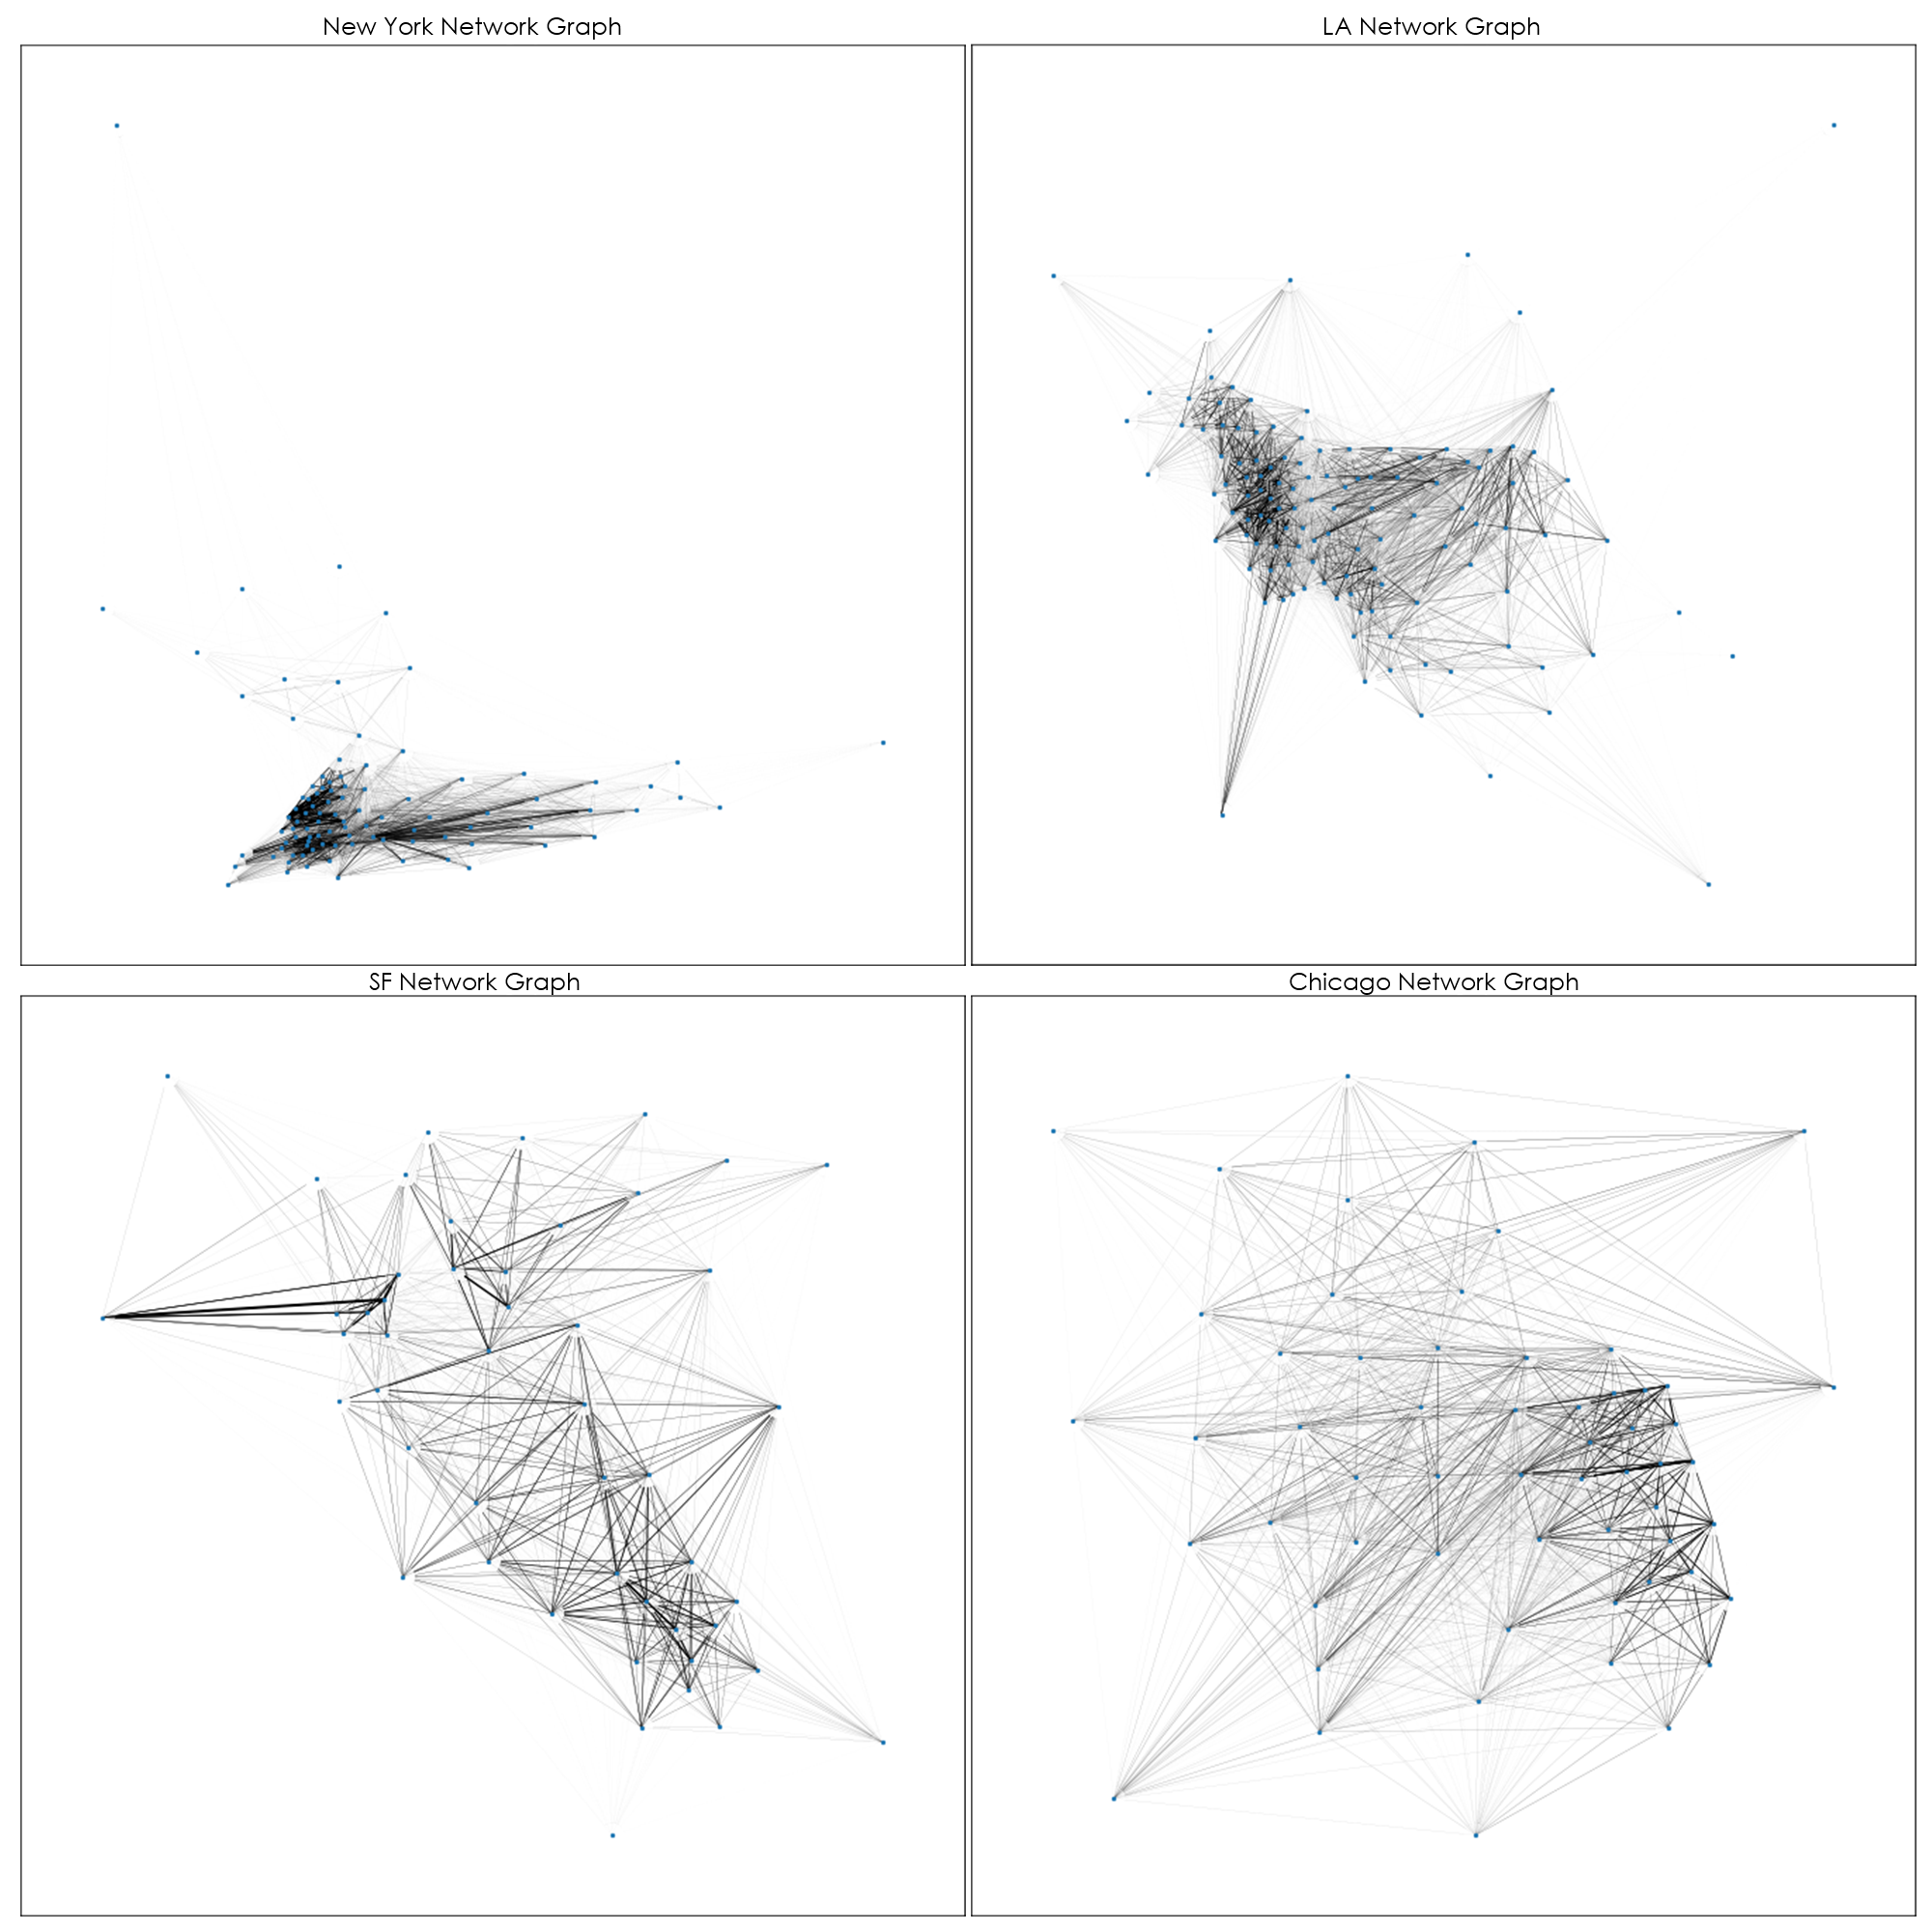
- View of the Origin-Dest data in the form of a network.
- Nodes represent centroids of PUMA level geometry.
- Edge weights represent aggregated GPS pings.


