The goal of this repository is to act as a starting point for reproductions, benchmarking and debugging.
- clone https://github.com/apollographql/rn-apollo-client-testbed
- npm install
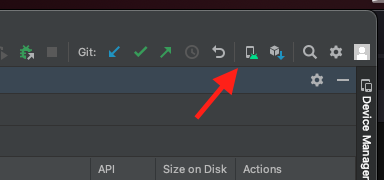
- If no android phone is available, download Android Studio, create a project, and set up the emulator (button in the top toolbar pretty much to the right)

- Download the latest “Android Internal Distribution build” from the Releases
- Install & start the app
- npm run start (will run expo start --dev-client --tunnel)
- Scan the QR code
- The app starts. You can now locally modify JavaScript sources. Unless new native dependencies are added, you do not need to rebuild the app.
- Install XCode and run the “Simulator” app
- Download the latest “iOS Simulator build” from the Releases
- unzip it and drag the unpacked “rnapolloclienttestbed” file onto the simulator
- Start the app
- npm run start (will run expo start --dev-client --tunnel)
- connect to http://localhost:8081
- The app starts. You can now locally modify JavaScript sources. Unless new native dependencies are added, you do not need to rebuild the app.
Watch the video: https://share.descript.com/view/8F2qEweqJoM
- Start the App
- Reload the App at least twice (press R in the expo dev server console). If you skip this step, you will record the wrong process and only see the Dev Menu stacks.
- In the expo dev server console window, press m to open the menu
- Scroll to the bottom, select “Open React Native Dev Menu”
- Select “Enable Sampling Profiler”
- Do the actions you want to record (warning: this might start hanging after a while!
- Press m again, go to the React Native Dev Menu again, select “Enable Sampling Profiler” again
- You will see a Toast “saved results from profiler”
- Open a second terminal window
- Run yarn react-native profile-hermes .
- A profile has been downloaded - check the next section on fixing up source map references
A recorded profile will still contain a lot of source map references and anonymous function names. That can be fixed by running
npx @phryneas/process-profile-sourcemaps ./sampling-profiler-traceXXXXXXXXXXXXXXXXXXX-converted.json ./sampling-profiler-traceXXXXXXXXXXXXXXXXXXX-converted-fixed.json- Toggle the Dev Menu from the Expo Terminal by pressing “m”
- Select “Open JS Debugger”
- A Chrome window with DevTools for the running app should open
You can use Flipper to look at both system and application logs, as well as debugging (like above). Flipper also includes the React Devtools and a bunch of other plugins.
This repo is set up for the Flipper React Native Apollo Devtools, so if you are using Flipper, you can install and enable the react-native-apollo-devtools plugin.
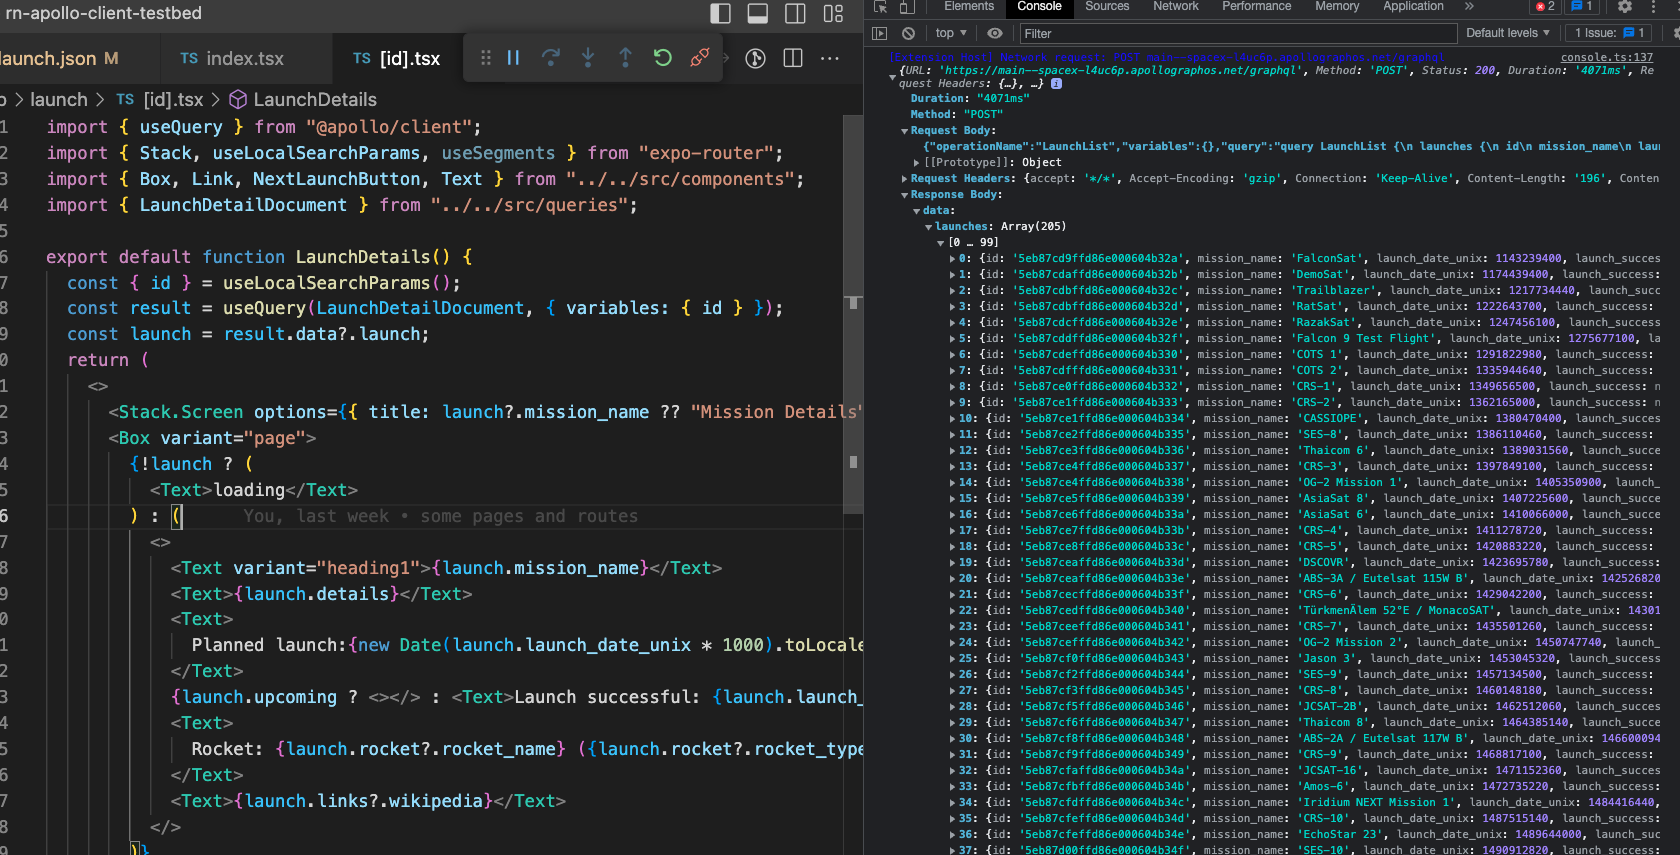
You can use the VSCode “React Native” extension to debug the app & inspect network traffic.
Start the application as usual. Then run the “Attach to Hermes application - Experimental” debugger configuration.
After that, press Cmd+Shift+P and run the “React native: run Network Inspector“ command, which will open devtools to the side where you will see network requests as console logs.
