Ricgraph (Research in context graph) is a graph with nodes (sometimes called vertices) and edges (sometimes called links) to represent objects and their relations. It can be used to store, manipulate and read metadata of any object that has a relation to another object, as long as every object can be "represented" by at least a name and a value. In Ricgraph, one node represents one object, and an edge represents the relation between two objects. It is written in Python and uses Neo4j as graph database engine.
Metadata of an object are stored as "properties" in a node, i.e. as information associated with a node. For example, a node may store two properties, name = PET and value = cat. Another node may store name = FULL_NAME and value = John Doe. Then the edge between those two nodes means that the person with FULL_NAME John Doe has a PET which is a cat.
The philosophy of Ricgraph is that it stores metadata, not the objects the metadata refer to. To access an object, a node has a link to that object in the system it was obtained from. The objective is to get metadata from objects from a source system in a process called "harvesting". All information harvested from several source systems will be combined into one graph. Modification of metadata of an object is done in the source system the object was harvested from, and then reharvesting of that source system.
To learn more about Ricgraph, read why Ricgraph has been developed, including an example. This is followed by a description how Ricgraph can be used. There is also a section with next steps you might want to take. You can also look at the videos we have made to demonstrate Ricgraph, or the presentations and mentions of Ricgraph.
Ricgraph has been developed because a university had a need to be able to show people, organizations and research outputs (e.g. books, journal articles, data sets, software, etc.) in relation to each other. This information is stored in different systems. That university needed to show research in context in a graph (hence the name). Ricgraph is able to answer questions like:
- Which person has contributed to which book, journal article, data set, software package, etc.?
- Given e.g. a data set or software package, who has contributed to it?
- What identifiers does a person have (there are a lot in use at universities)?
- Show a network of persons who have worked together?
- For what organization does a person work? So which organizations have worked together?
Ricgraph provides example code to do this. We have chosen a graph as a datastructure, since it is a logical and efficient method to access objects which are close to objects they have a relation to. For example, starting with a person, its research outputs are only one step away by following one edge, and other contributors to that research output are again one step (edge) away.
In the remainder of this text, Ricgraph is described in the use case of showing people, organizations and research outputs in relation to each other in a university context.
See the figures below for example graphs that show how Ricgraph works. Click a figure to enlarge.
| one person with several research outputs | symbols for type of object | colors for source system |
|---|---|---|
 |
 |
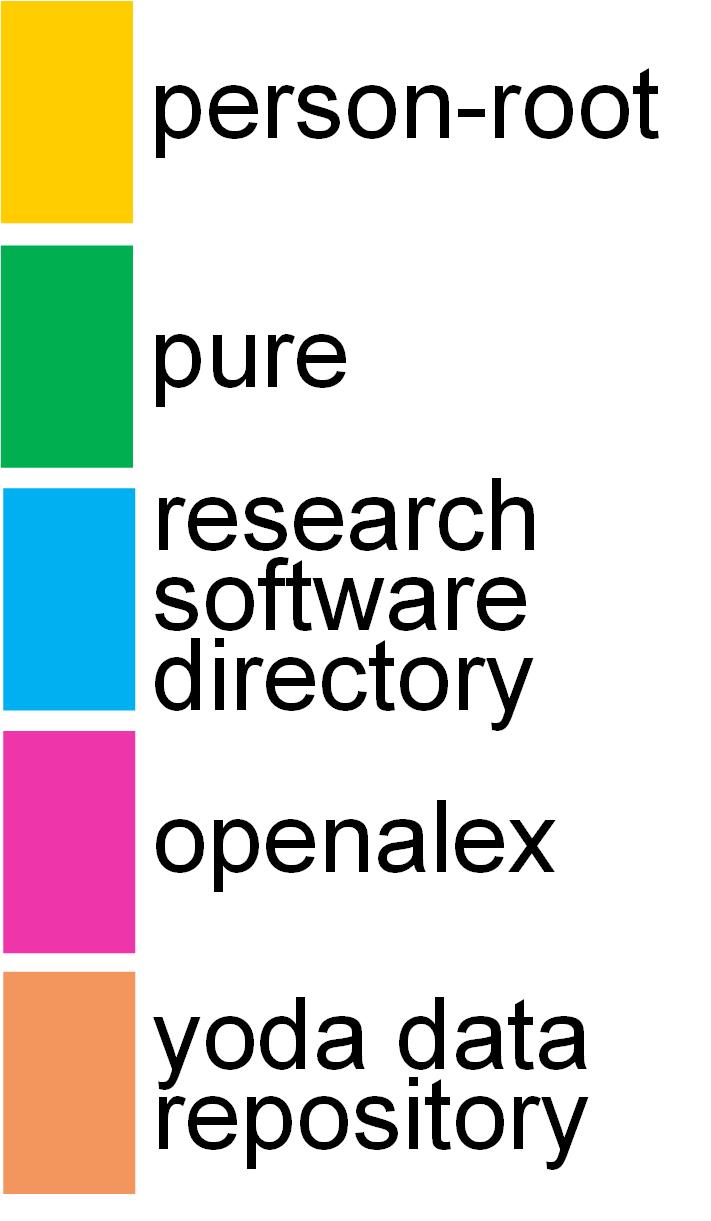 |
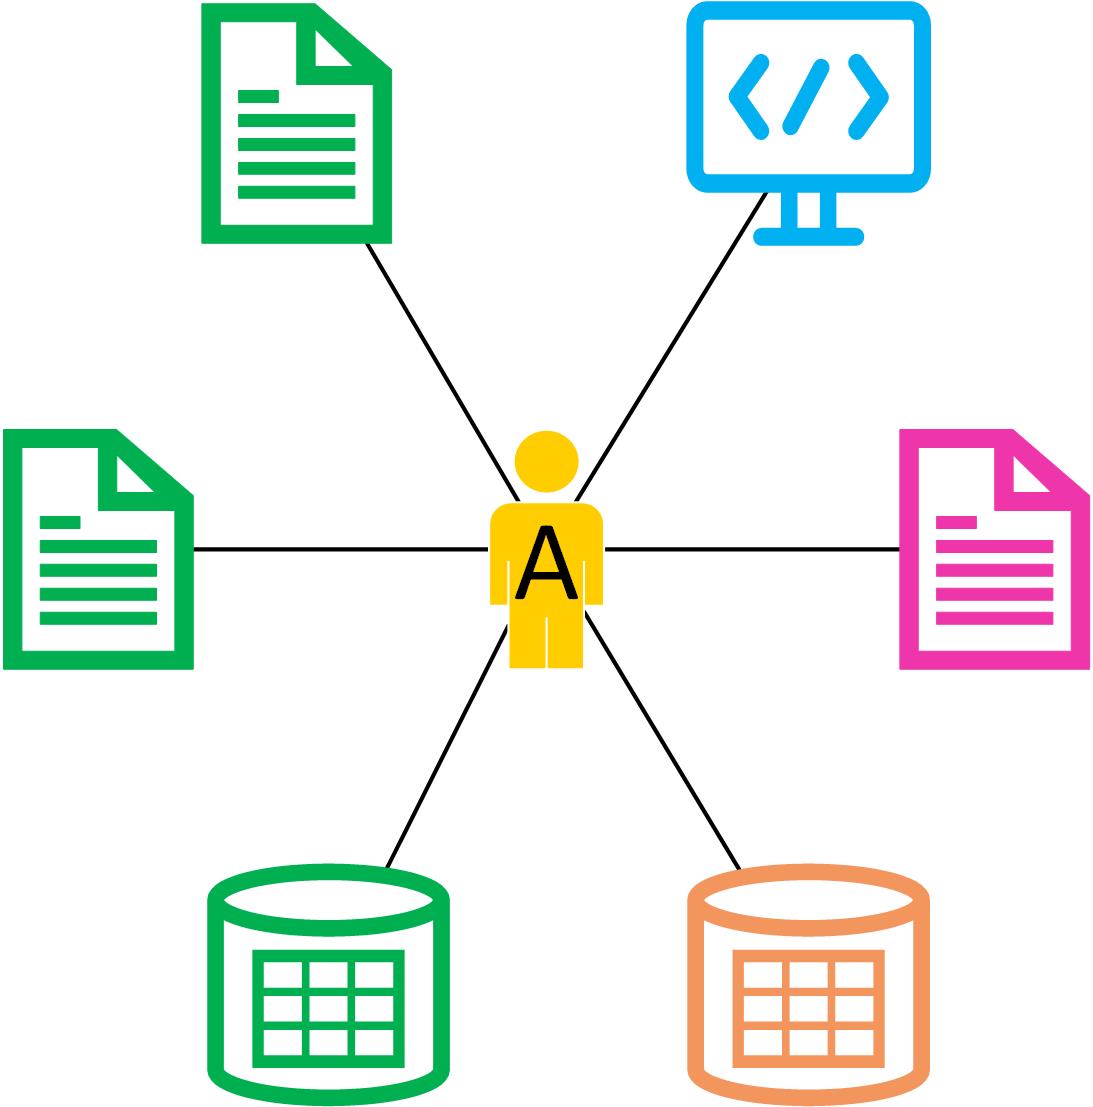
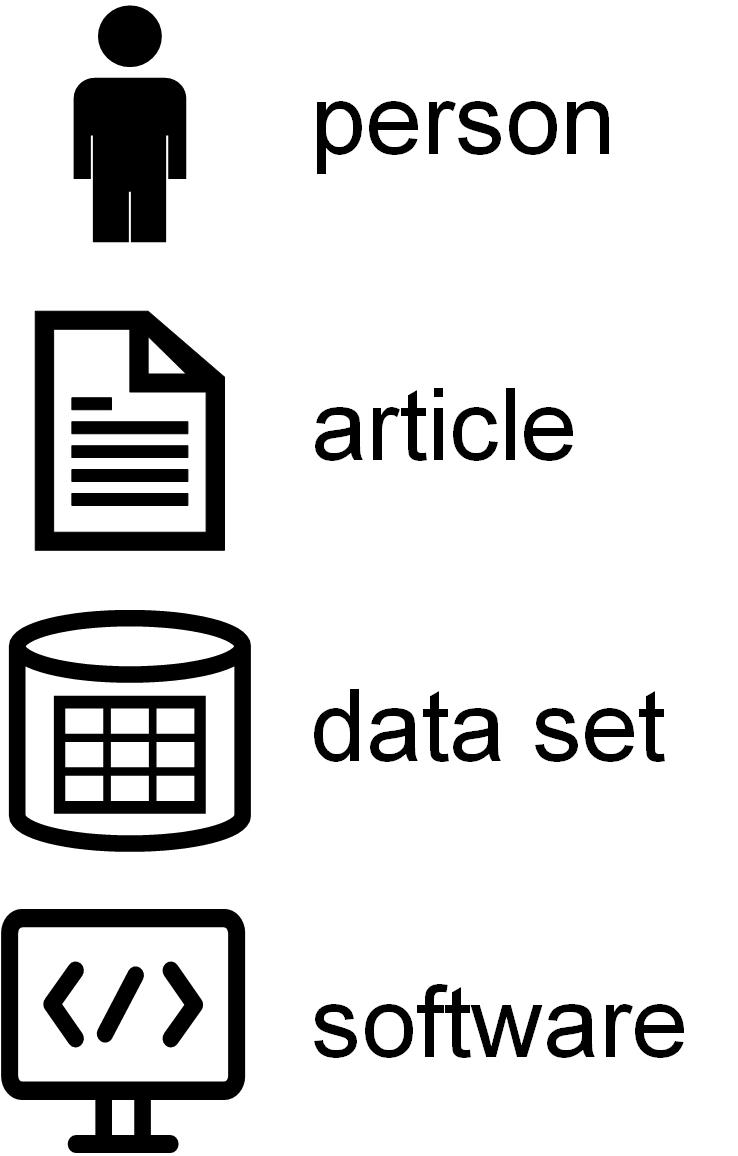
This figure shows one person A using a person-root node, a node which "represents" a person as it is called in Ricgraph. This person has contributed to three articles, two data sets and one software package. Two articles and one data set are from the Research Information System Pure (their color is green), one data set is from the data repository Yoda (in orange), one article is from OpenAlex (in purple), and the software package is from the Research Software Directory (in blue).
| several persons with several research outputs | one person with several identifiers and research outputs |
|---|---|
 |
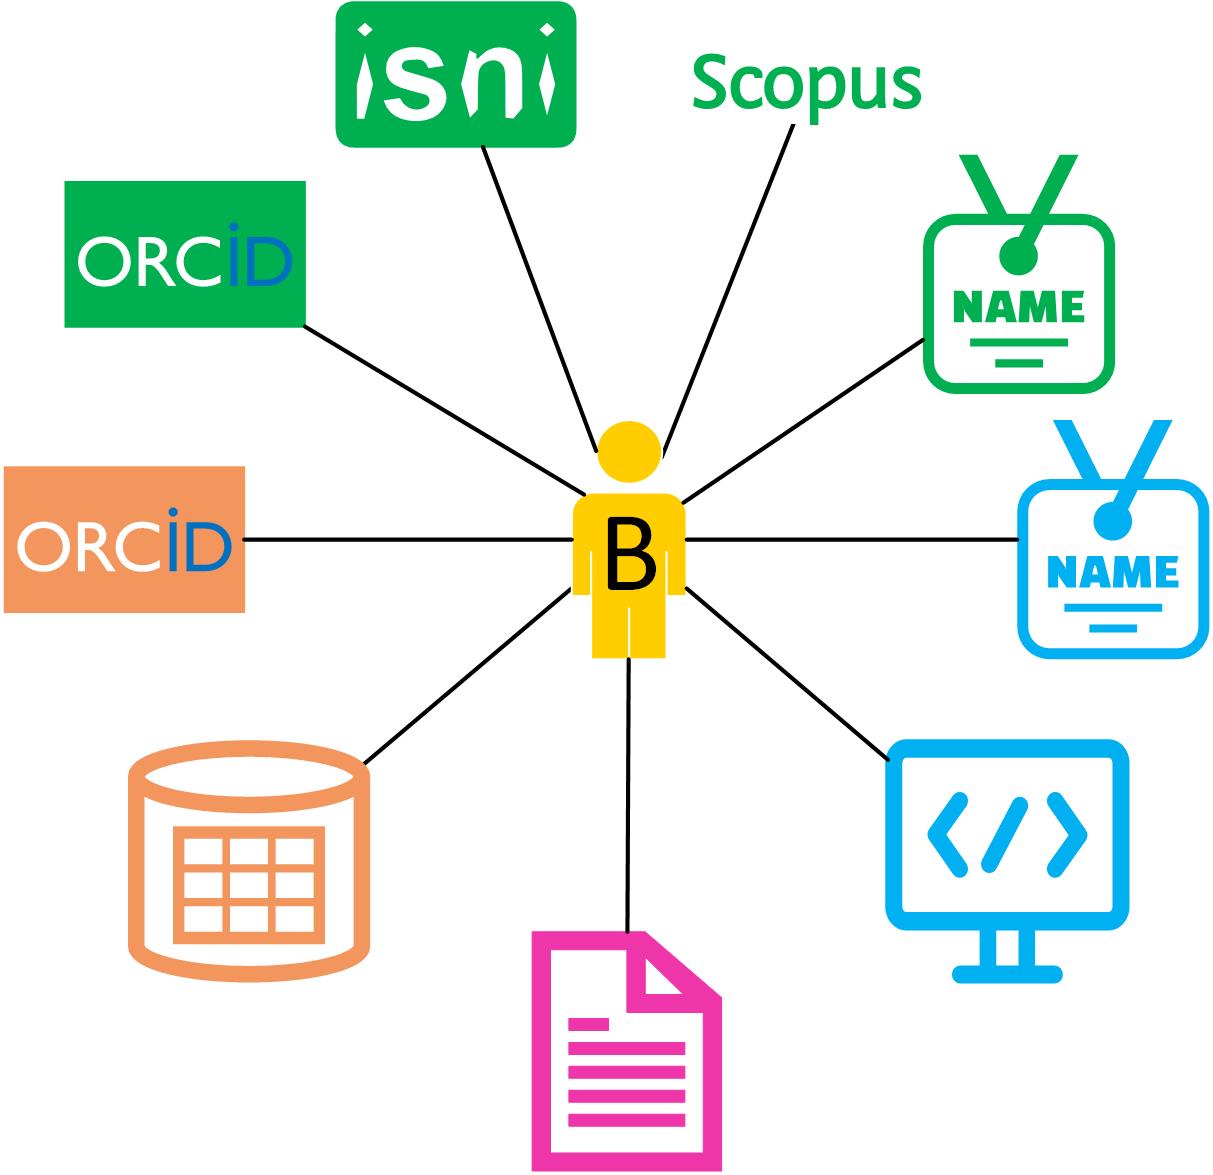 |
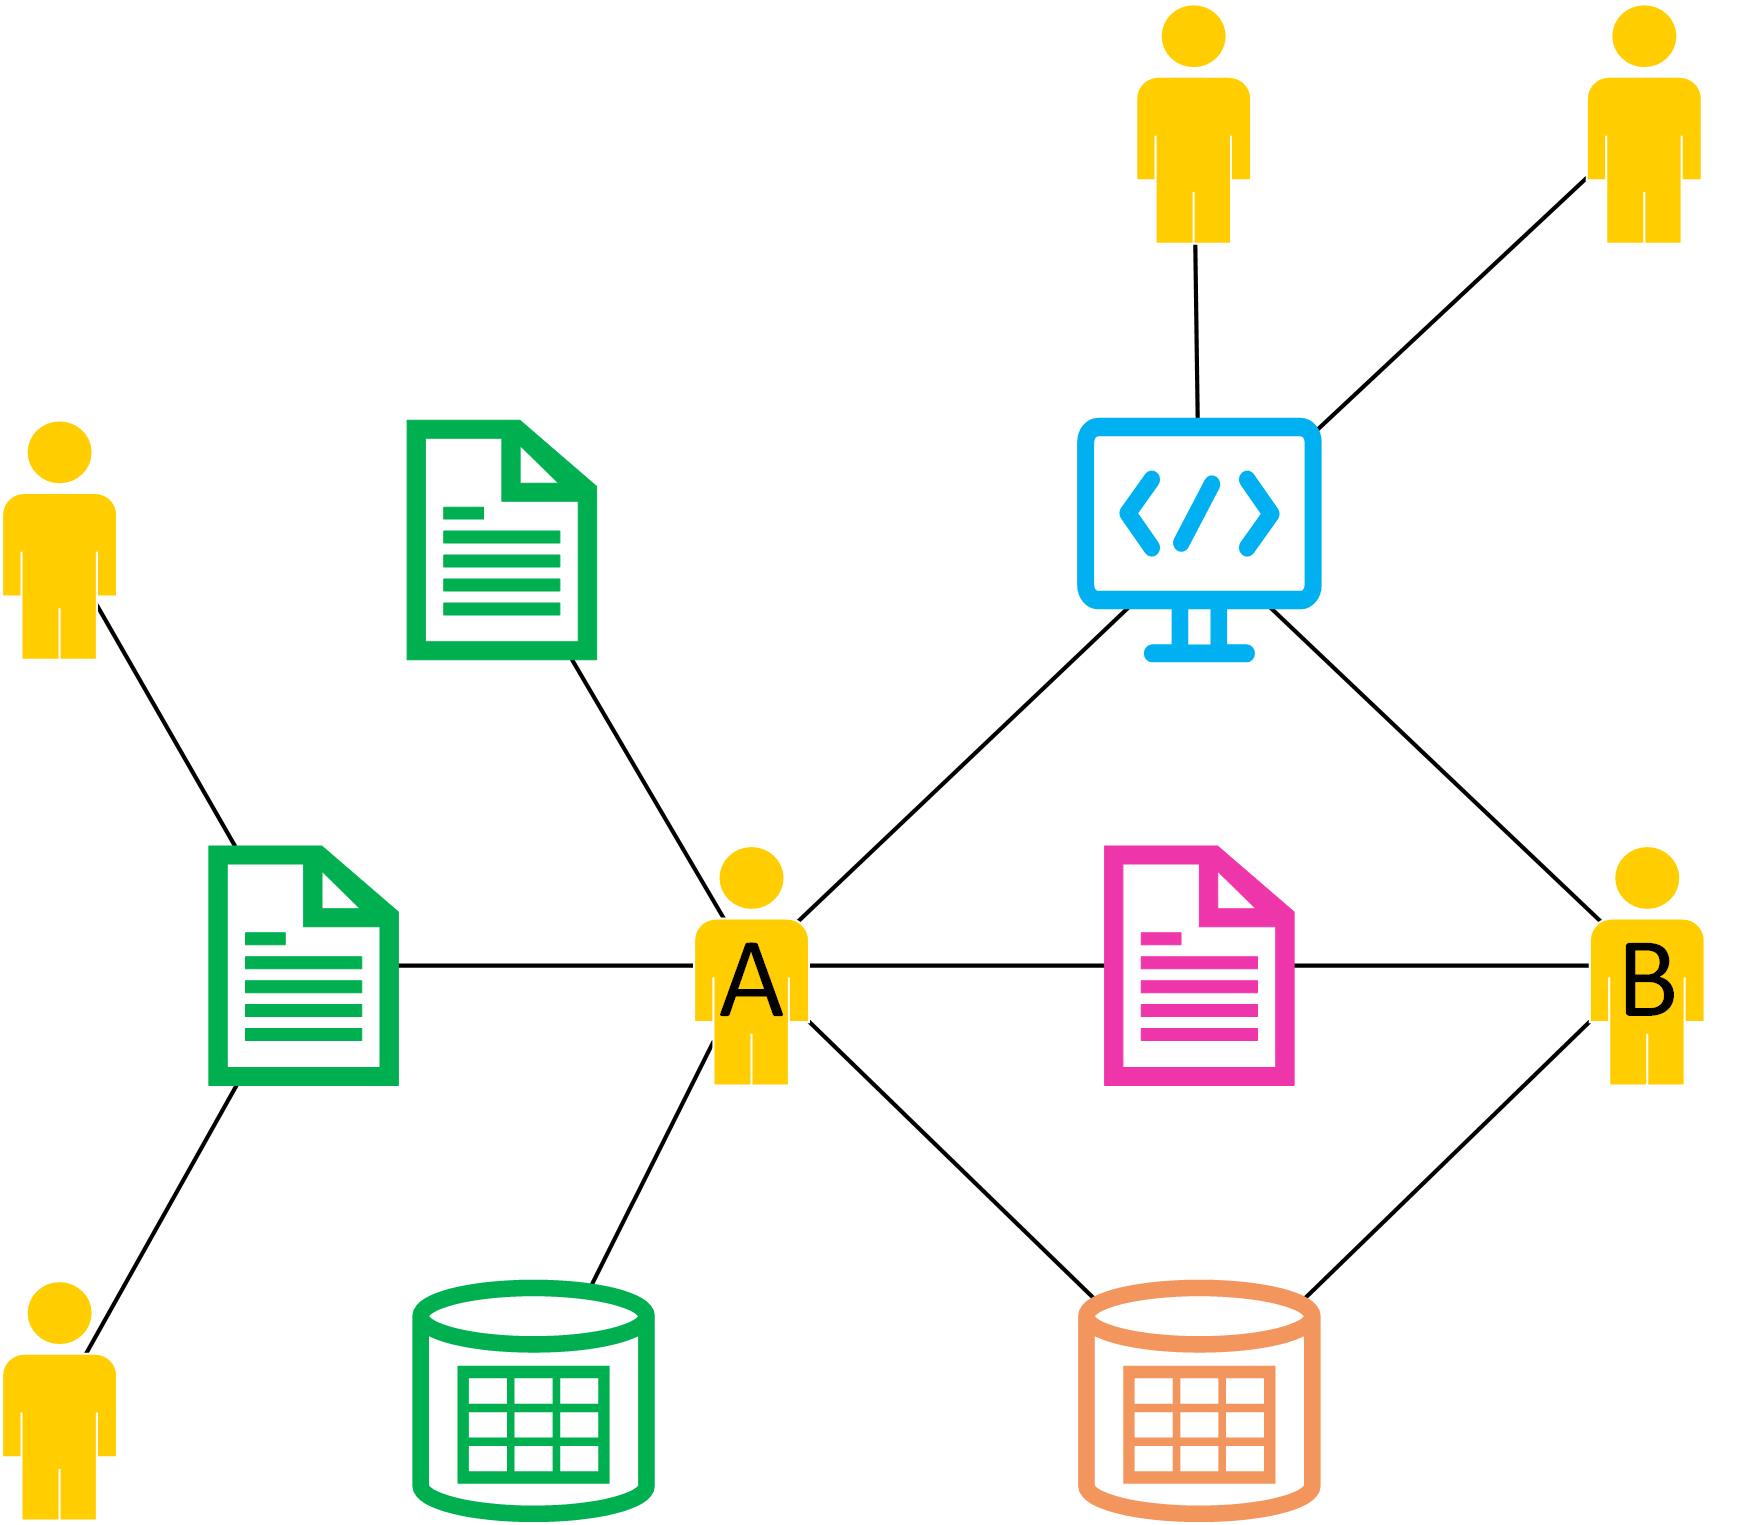
The left part of this figure shows several persons having several research outputs (the symbols) and how these are related (i.e. which person contributed to which research output). It also shows from which source system these research outputs have originated (using different colors). The right part shows one person having several identifiers and several research outputs. This person has two different ORCIDs, one ISNI, one SCOPUS_AUTHOR_ID, and two FULL_NAMEs (which differ in spelling). These identifiers have also been obtained from different source systems, as their color indicates.
More examples can be found in Ricgraph details.
Some of Ricgraph's features are:
- Ricgraph stores metadata of objects. The objective is to get metadata from objects from a source system in a process called "harvesting". That means that e.g. persons and publications can be harvested from one system, data sets from another system, and software from a third system. Everything found will be combined into one graph.
- Ricgraph can harvest from many sources, and you can write your own harvesting scripts. Example scripts are included to harvest from the Research Information System Pure, the data repository Yoda, and the Research Software Directory.
- Ricgraph can be used as an ID resolver. It can, given an identifier of a person, easily find other identifiers of that person. When new identifiers are found when harvesting from new systems, they will be added automatically. It can form the core engine for the Dutch National Roadmap for Persistent Identifiers.
- Since Ricgraph combines information from different sources in one graph, it can be used as a discoverer (an aggregated search engine), such as the UU-discoverer. Also, it can be used as a core engine for the Dutch Open Knowledge Base.
- Ricgraph can check the consistency of information harvested. For example, ORCIDs and ISNIs are supposed to refer to one person, so every node representing such an identifier should have only one edge. This can be checked easily. An example script is included.
- Ricgraph can enrich information. For example, if a person has an ORCID, but not a Scopus Author ID, OpenAlex can be used to find the missing ID. If something is found, it is added to the person record. An example script is included.
- Ricgraph can store any number of properties in a node. It has function calls to create, read (find), update and delete (CRUD) nodes and to connect two nodes.
- To query, visualize and explore the graph, see Query and visualize Ricgraph.
- Read more about Ricgraph details, such as example graphs, person identifiers and the person-root node.
- Look at the videos we have made to demonstrate Ricgraph.
- You might want to compare Ricgraph to other systems.
- Install and configure Ricgraph.
- Start harvesting data, see Ricgraph harvest scripts, e.g. by doing a harvest for Utrecht University data sets and software. You will observe that the information from two sources is neatly combined into one graph.
- Start writing scripts, see Ricgraph script writing.
- To query, visualize and explore the graph, see Query and visualize Ricgraph.
- Of course, there is future work to do. Please let me know if you'd like to help.