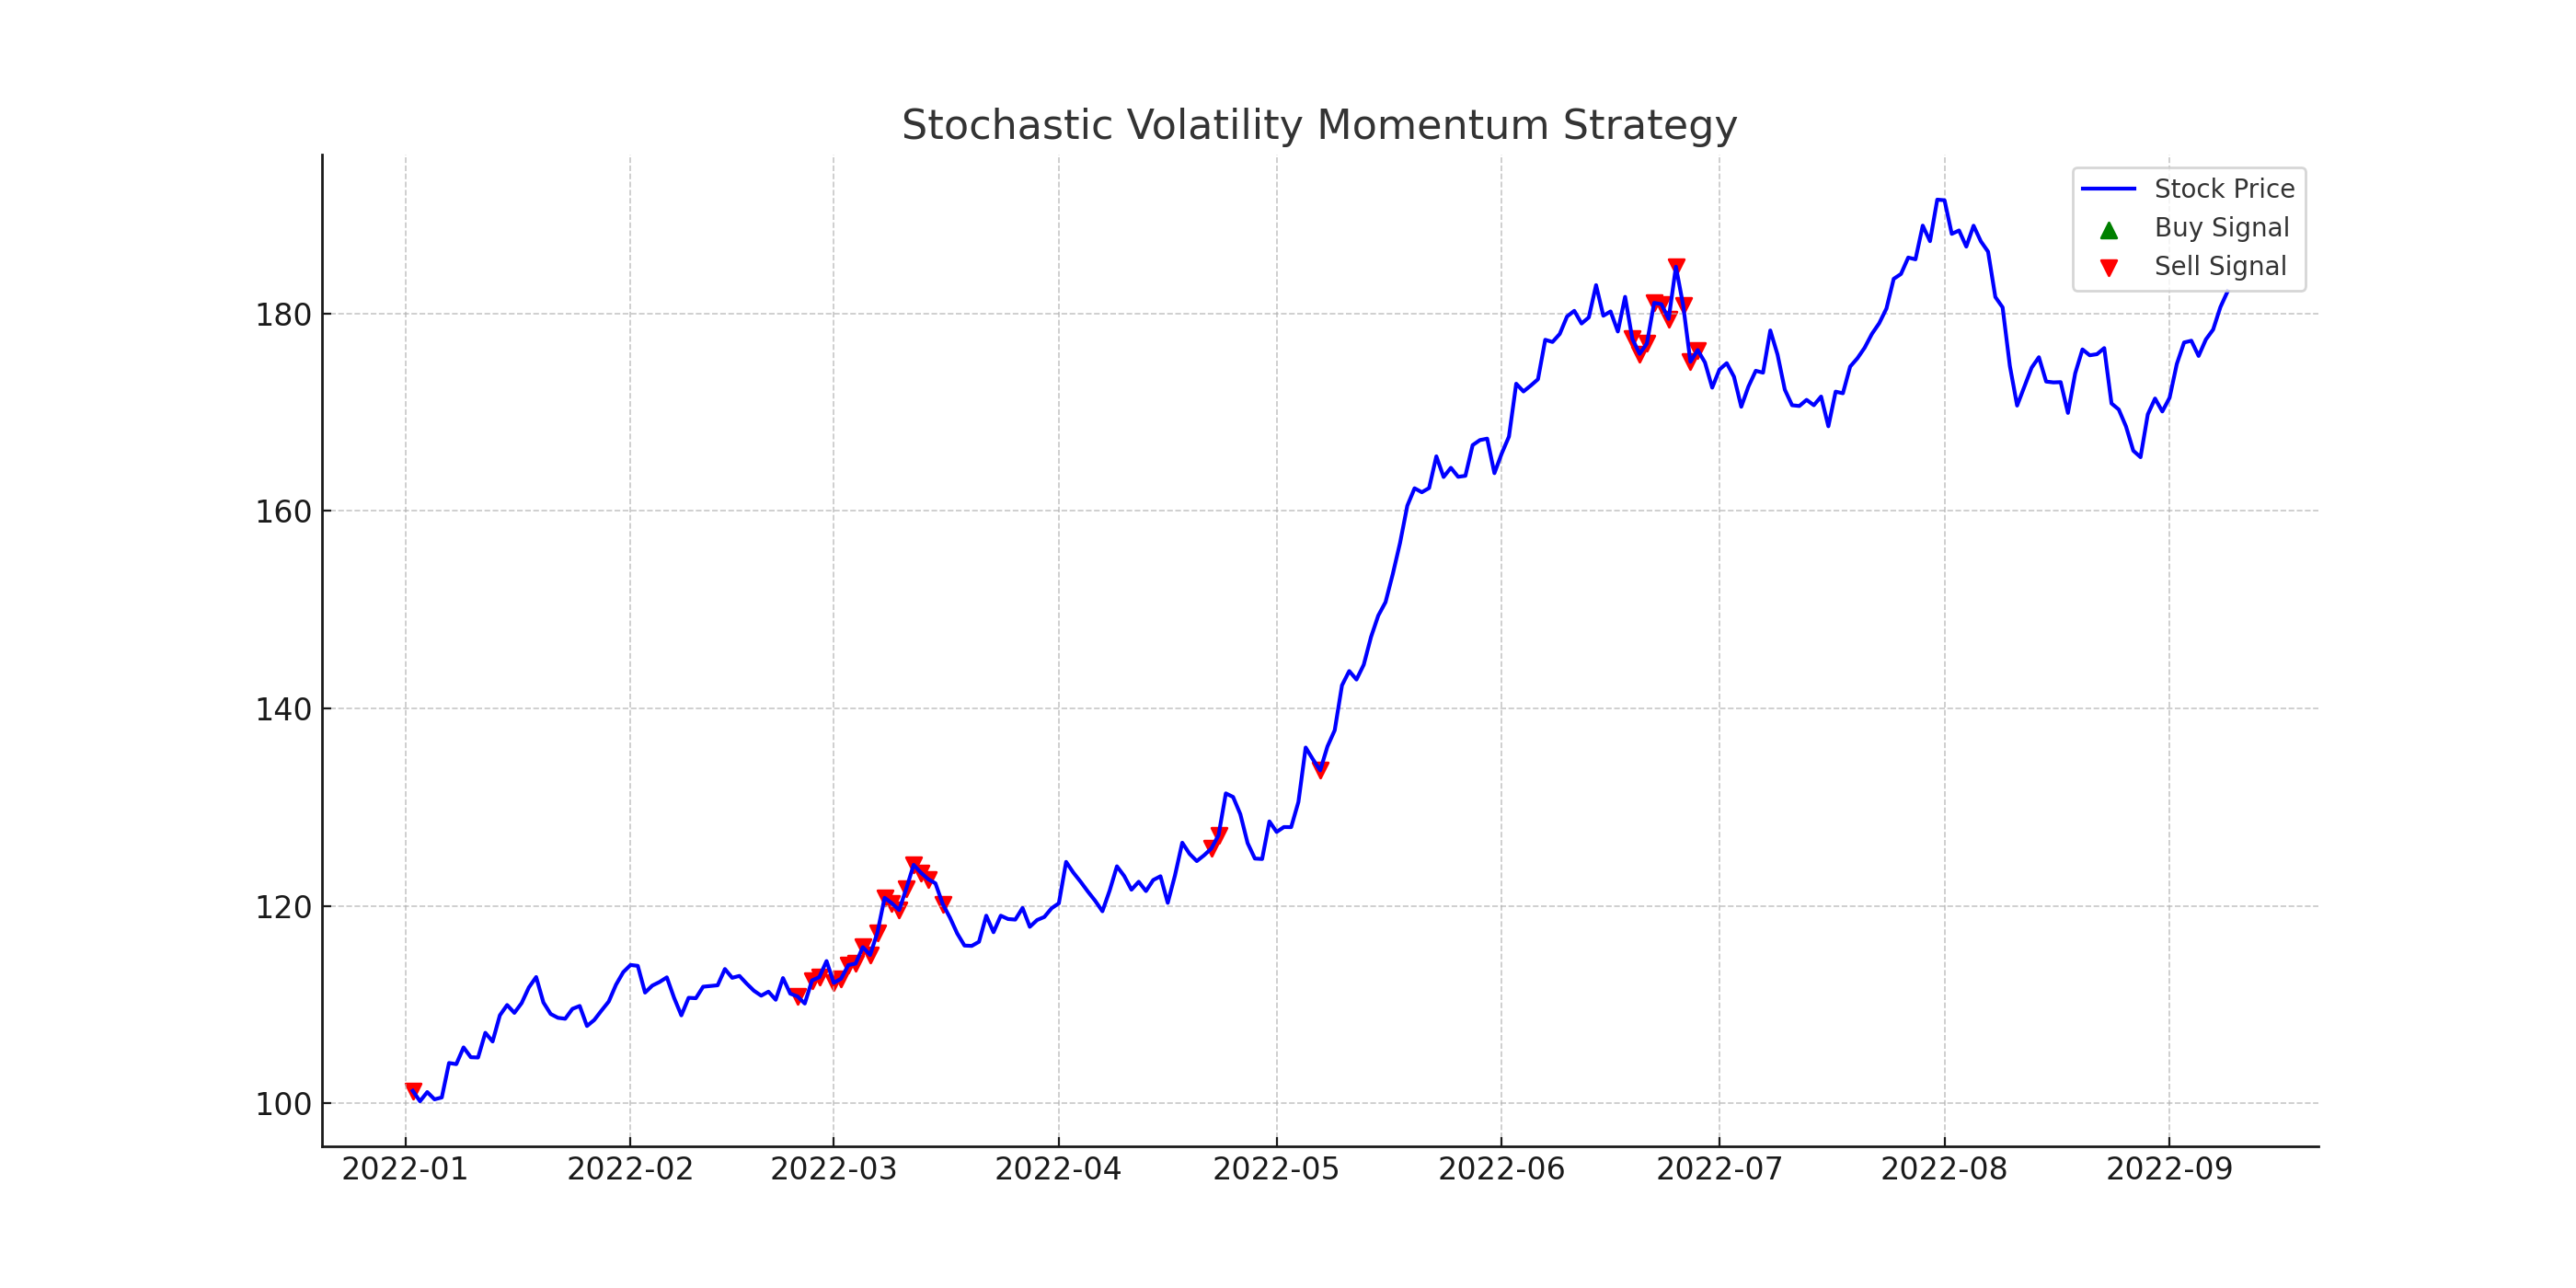
A quantitative trading strategy that combines the principles of the Heston stochastic volatility model with momentum indicators to generate buy/sell signals.
Financial markets often exhibit periods of low and high volatilities. The SVMS strategy aims to exploit these patterns by combining:
- Heston Model: A stochastic volatility model that allows for a dynamic volatility path.
- Momentum Indicators: Used to capture the momentum in the asset price, indicating potential buy/sell opportunities.
The Heston model captures the dynamics of an asset's price and its volatility. The model uses two stochastic differential equations: one for the asset price and another for its variance.
RSI is a momentum oscillator that measures the speed and change of price movements. It oscillates between 0 and 100 and is typically used to identify overbought or oversold conditions.
- Python 3.x
- NumPy
- pandas
- Matplotlib
- Ensure you have all the required libraries installed.
- Clone the repository or download the
svms_strategy.pyscript. - Execute the script:
python svms_strategy.py
- The script will generate a visualization of the stock price, volatility, and buy/sell signals.
Pull requests are welcome. For major changes, please open an issue first to discuss what you would like to change.
