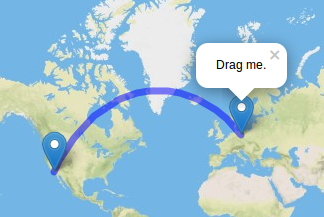
Add-on for Leaflet to draw geodesic lines and great circles. A geodesic line is the shortest path between two given positions on the earth surface. Wrapping at lng=180° is handled correctly. The master branch is compatible with Leaflet v1.0.2+.
It is based on geodesy by Chris Veness that gives extremely precise results.
Add the source to your project/html-file after leaflet.js:
<script src="leaflet.js"></script>
<script src="Leaflet.Geodesic.js"></script>
Leaflet.Geodesic can be used similar to Leaflet's Polyline.
L.geodesic( <LatLng[][]> latlngs, <Geodesic options> options? )Geodesic has the following options:
| Option | Type | Default | Description |
|---|---|---|---|
steps |
Number |
10 |
Defines how many intermediate points are generated along the path. More steps mean a smoother path but more resources. |
color |
String |
blue |
Stroke color. |
dash |
Number |
1 |
Use a number between 0..1 to create a dashed line. The given number represents the percentage of the actual dash between each intermediate point (0.5 means the line is drawn half the length) defined by steps. See example below. |
wrap |
Boolean |
true |
Wrap line at map border (date line). Set to 'false' if you want lines to cross the dateline (experimental, see noWrap-example on how to use) |
All options of Leaflet's Polyline can be used as well.
You need to add the plugin in your html file after the leaflet file
<script src="leaflet.js"></script>
<script src="Leaflet.Geodesic.js"></script>
This code creates an empty Geodesic object:
var Geodesic = L.geodesic([], {
	weight: 7,
	opacity: 0.5,
	color: 'blue',
	steps: 50
}).addTo(map);
To actually draw a line, we need to create and set the coordinates of our geodesic line:
var berlin = new L.LatLng(52.5, 13.35);
var losangeles = new L.LatLng(33.82, -118.38);

Geodesic.setLatLngs([[berlin, losangeles]]);
A geodesic line can have more than two Points:
var berlin = new L.LatLng(52.5, 13.35);
var losangeles = new L.LatLng(33.82, -118.38);
var capetown = new L.LatLng(-33.91, 18.41);

Geodesic.setLatLngs([[berlin, losangeles, capetown]]);
You can also draw independent lines within one geodesic object:
var berlin = new L.LatLng(52.5, 13.35);
var losangeles = new L.LatLng(33.82, -118.38);
var capetown = new L.LatLng(-33.91, 18.41);
var sydney = new L.LatLng(-33.91, 151.08);

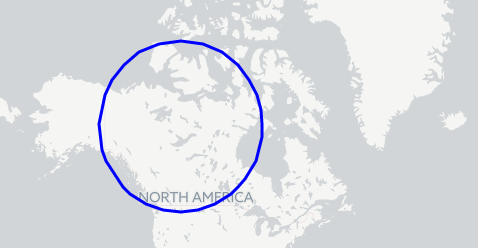
Geodesic.setLatLngs([[berlin, losangeles], [capetown, sydney]]);Draw a circle around a given position.
L.Geodesic.createCircle(<LatLng> center, <Number> radius)| Parameter | Type | Description |
|---|---|---|
center |
L.LatLng |
geographic position/center of the circle |
radius |
Number |
Radius of the circle in metres |
var Geodesic = L.geodesic([], {steps:40}).addTo(map);
Geodesic.createCircle(new L.LatLng(61.07, -114.35), 1500000);
see also: Great Circle Demo
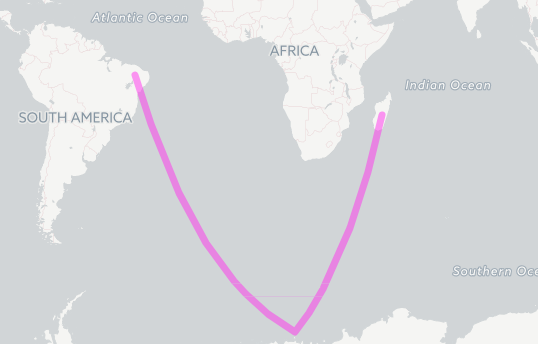
Draw geodesic lines given in GeoJSON-format. LineString, MultiLineString and Polygon geometries are supported.
- Refer to GeoJSON-Specification (RFC7946) for details.
- Draw your own GeoJSON-Objects at geojson.io.
| Parameter | Type | Description |
|---|---|---|
geojson |
Object |
GeoJSON-Object to draw as geodesic-lines. |
var geojsonExample =
{
	"type": "FeatureCollection",
	"features": [
		{
			"type": "Feature",
			"properties": {},
			"geometry": {
				"type": "LineString",
				"coordinates": [
					[-40.07, -6.66],
					[16.17, -69.16],
					[46.75, -20.30]
				]
			}
		}
	]
}

var geodesicLayer = L.geodesic([], {
	weight: 7,
	opacity: 0.5,
	color: '#ff33ee',
	steps: 50,
	wrap: false,
}).addTo(map)

geodesicLayer.geoJson(geojsonExample)see http://jsfiddle.net/h1r3yagb/
see http://jsfiddle.net/h1r3yagb/20/
in options set: fill: true. See also Leaflet's Path API reference
var Geodesic3 = L.geodesic([], {
	weight:3, opacity:1, fill: true,
	color: 'green',	steps: 40}).addTo(map);
Geodesic3.createCircle(calgary, 2000000);See henrythasler#31 Also includes a minified version
Please look at the branch legacy to use Leaflet.Geodesic with Leaflet v0.7.7 and before. The master and testing branches can only be used with Leaflet v1.0.0+.
GPL V3


