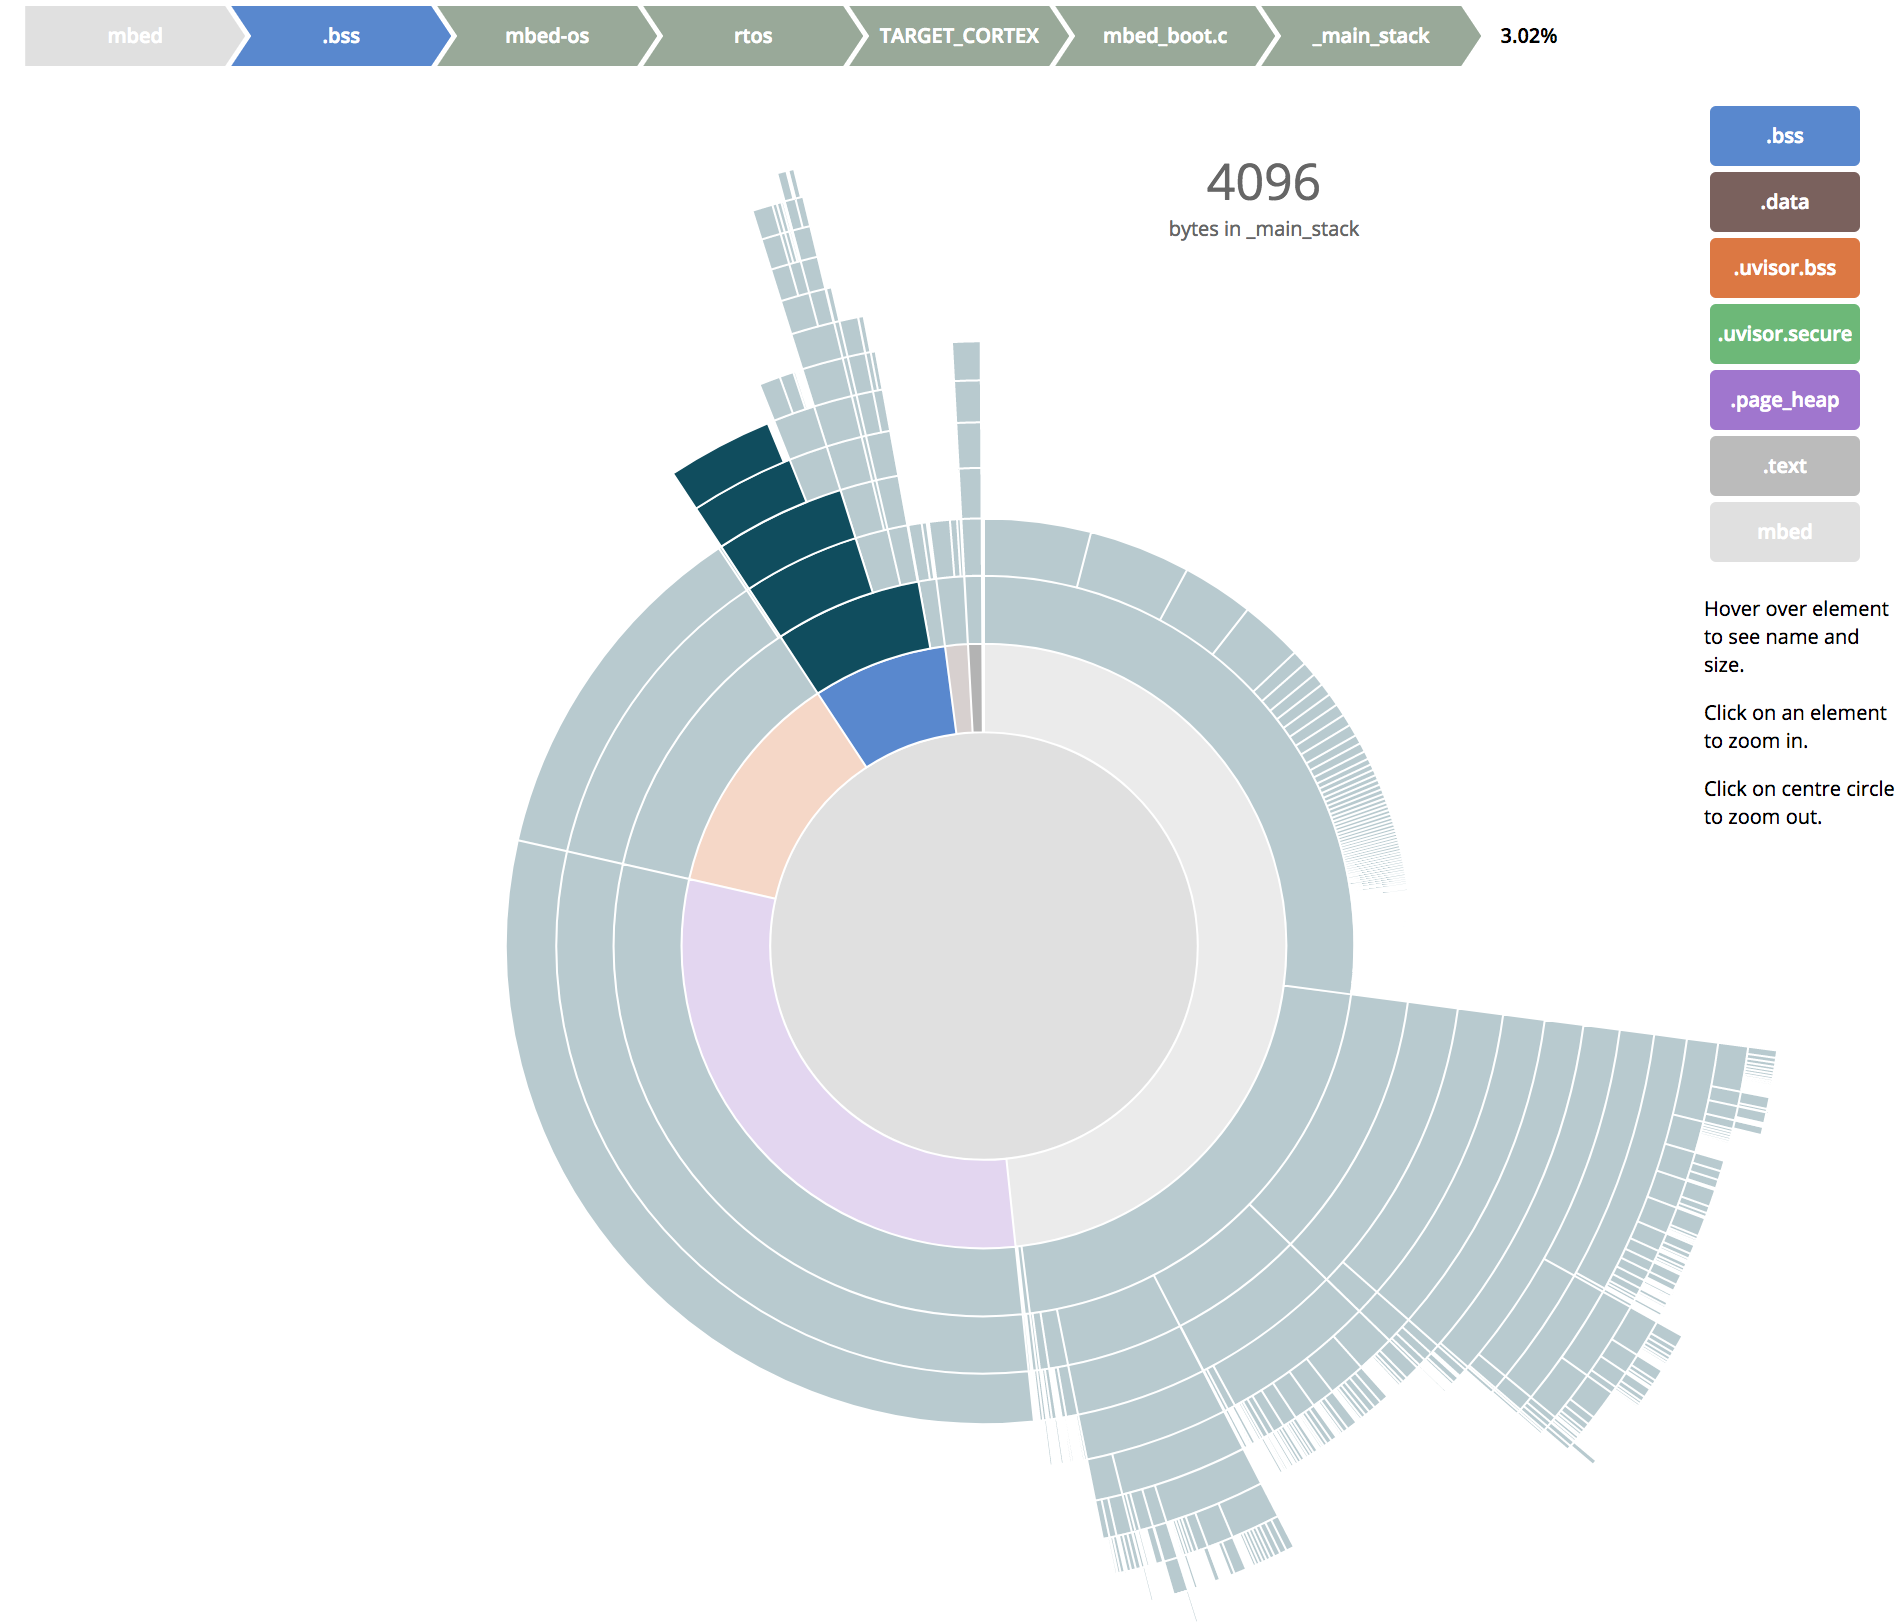
This repository is used to generate interactive linker statistics. Please have a look at our interactive example.
Install arm-none-eabi-gcc and add to your path. This will install arm-none-eabi-nm. The analysis tool require the executable arm-none-eabi-nm to be present in your environemntal PATH.
Then clone the tool to a local directory
git clone https://github.com/ARMmbed/mbed-os-linker-reportIf you want to know how much each file contributes to the final size of the binary mbed-cli provides these statistics at compile time:
> mbed compile -m K64F -t GCC_ARM --stats-depth=100
Building project mbed-os-example-blinky (K64F, GCC_ARM)
Scan: .
Scan: mbed
Scan: env
Scan: FEATURE_LWIP
Scan: FEATURE_STORAGE
...
+--------------------------------------------------------------------------------------------------------------------+-------+-------+------+
| Module                                                                                                             | .text | .data | .bss |
+--------------------------------------------------------------------------------------------------------------------+-------+-------+------+
| [fill]                                                                                                             |    86 |     4 | 2369 |
| [lib]/libc.a/lib_a-abort.o                                                                                         |    16 |     0 |    0 |
| [lib]/libc.a/lib_a-closer.o                                                                                        |    36 |     0 |    0 |
| [lib]/libc.a/lib_a-ctype_.o                                                                                        |   257 |     0 |    0 |
| [lib]/libc.a/lib_a-fputwc.o                                                                                        |   264 |     0 |    0 |
...
...
...
| mbed-os/rtos/rtx5/mbed_rtx_handlers.o                                                                              |   649 |     0 |    0 |
| mbed-os/targets/TARGET_Freescale/TARGET_MCUXpresso_MCUS/TARGET_MCU_K64F/TARGET_FRDM/PeripheralPins.o               |   288 |     0 |    0 |
| mbed-os/targets/TARGET_Freescale/TARGET_MCUXpresso_MCUS/TARGET_MCU_K64F/TARGET_FRDM/fsl_clock_config.o             |   120 |     0 |    0 |
| mbed-os/targets/TARGET_Freescale/TARGET_MCUXpresso_MCUS/api/sleep.o                                                |    16 |     0 |    0 |
| Subtotals                                                                                                          | 44769 |  2680 | 9080 |
+--------------------------------------------------------------------------------------------------------------------+-------+-------+------+
Total Static RAM memory (data + bss): 11760 bytes
Total Flash memory (text + data): 47449 bytes

Image: ./BUILD/K64F/GCC_ARM/mbed-os-example-blinky.bin
To turn this data into the example visualisation:
> mbed compile --stats-depth=100 | ../mbed-os-linker-report/binsize.py -b
For performing the analysis, you need to recompile your program. You need to enable debugging info in your elf file by passing the -g option to gcc. The default mbed-os compile profile does not do this, hence you need to use the modified profile inside the compiler_profiles folder.
# For develop profile
> mbed compile -m K64F -t GCC_ARM -c --profile=../mbed-os-linker-report/compiler_profiles/develop.json
# For release profile
> mbed compile -m K64F -t GCC_ARM -c --profile=../mbed-os-linker-report/compiler_profiles/release.json
# For debug profile
> mbed compile -m K64F -t GCC_ARM -c --profile=debug
Note: if you have a custom compiler profile, you will need to add the "-g" flag in the "common" section.
Now run the ELF linker statistics tool:
# Process Data: provide one or more elf files for analysis
> python ../mbed-os-linker-report/elfsize.py -i BUILD/K64F/GCC_ARM/mbed-os-example-blinky.elf -b
This will open up a browser page automatically with the visualisation.
> python binsize.py -h
usage: binsize.py [-h] [-o OUTPUT] [-b]

Analyse mbed compile output from stdin and generate a json data file for
visualisation

optional arguments:
  -h, --help            show this help message and exit
  -o OUTPUT, --output OUTPUT
                        path of output json, defaults to
                        /Users/leozhou/projects/mbed-os-linker-report/html
                        /data-flare.js, default filename to data-flare.js if a
                        folder is specified
  -b, --browser         launch the pie chart visualisation in a browser

> python elfsize.py -h
usage: elfsize.py [-h] -i [BINARY [BINARY ...]] [-o OUTPUT] [-b]

Analyse binary built by gcc and generate json containing binary size
information

optional arguments:
  -h, --help            show this help message and exit
  -i [BINARY [BINARY ...]], --binary [BINARY [BINARY ...]]
                        path to the binary. You can also specify multiple
                        binaries: -i <path1> <path2>
  -o OUTPUT, --output OUTPUT
                        path of output json, defaults to
                        /Users/leozhou/projects/mbed-os-linker-report/html
                        /data-flare.js, default filename to data-flare.js if a
                        folder is specified
  -b, --browser         launch the pie chart visualisation in a browser
For uVisor the statistics of two ELF files need to be combined into a single JSON file. This is how it works:
# Download latest version of a uVisor enabled app
> mbed import mbed-os-example-uvisor
# Change into that directory
> cd mbed-os-example-uvisor
# Recompile uVisor - the command below needs to run twice due to a Makefile bug
> make -C mbed-os/features/FEATURE_UVISOR/importer
# Recompile mbed-os app
# For develop profile
> mbed compile -m K64F -t GCC_ARM -c --profile=../mbed-os-linker-report/compiler_profiles/develop.json
# Combine both elf outputs into a singe JSON file
> python ../mbed-os-linker-report/elfsize.py -i mbed-os/features/FEATURE_UVISOR/importer/TARGET_IGNORE/uvisor/platform/kinetis/release/configuration_kinetis_cortex_m4_0x1fff0000.elf BUILD/K64F/GCC_ARM/mbed-os-example-uvisor.elf -bBelow you can find an example screenshot of our tool. Please have a look at our interactive example, too.
